Free Access
Fig. 9
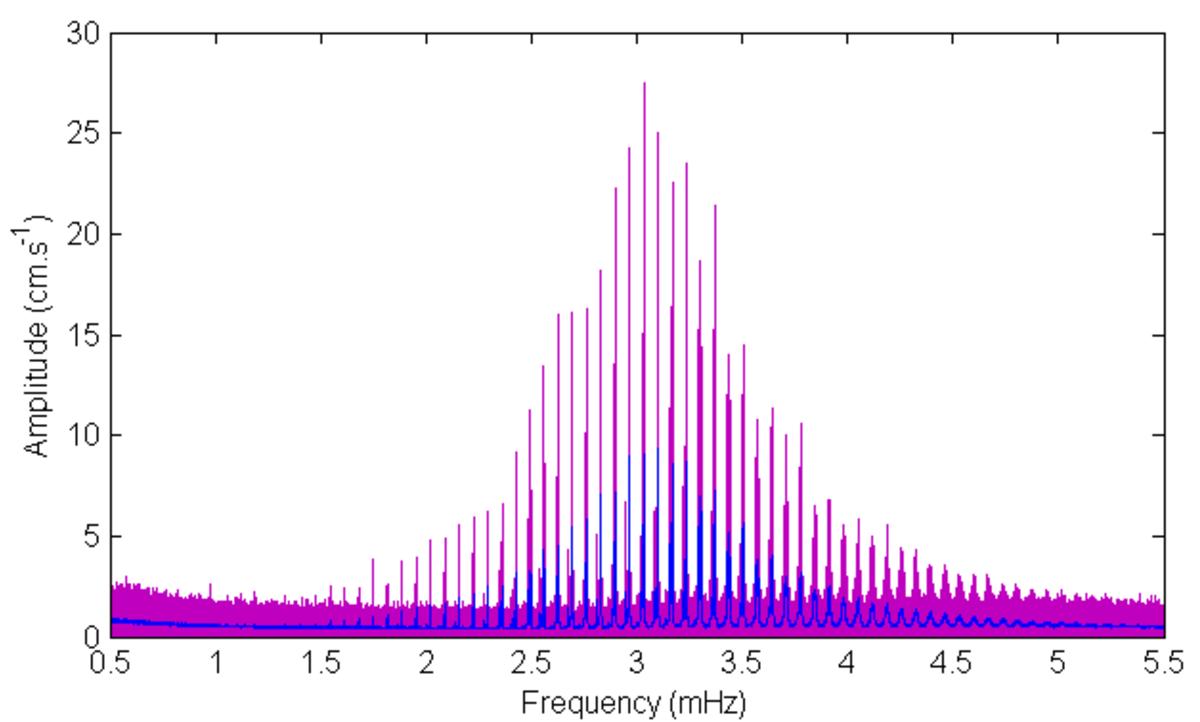
Estimate of the amplitude spectrum (square root of the density power spectrum) in blue, superposed on the modulus of the Fourier transform of the GOLF time series (in magenta). This estimate was used to calculate simulated time series.
Current usage metrics show cumulative count of Article Views (full-text article views including HTML views, PDF and ePub downloads, according to the available data) and Abstracts Views on Vision4Press platform.
Data correspond to usage on the plateform after 2015. The current usage metrics is available 48-96 hours after online publication and is updated daily on week days.
Initial download of the metrics may take a while.