Fig. 34
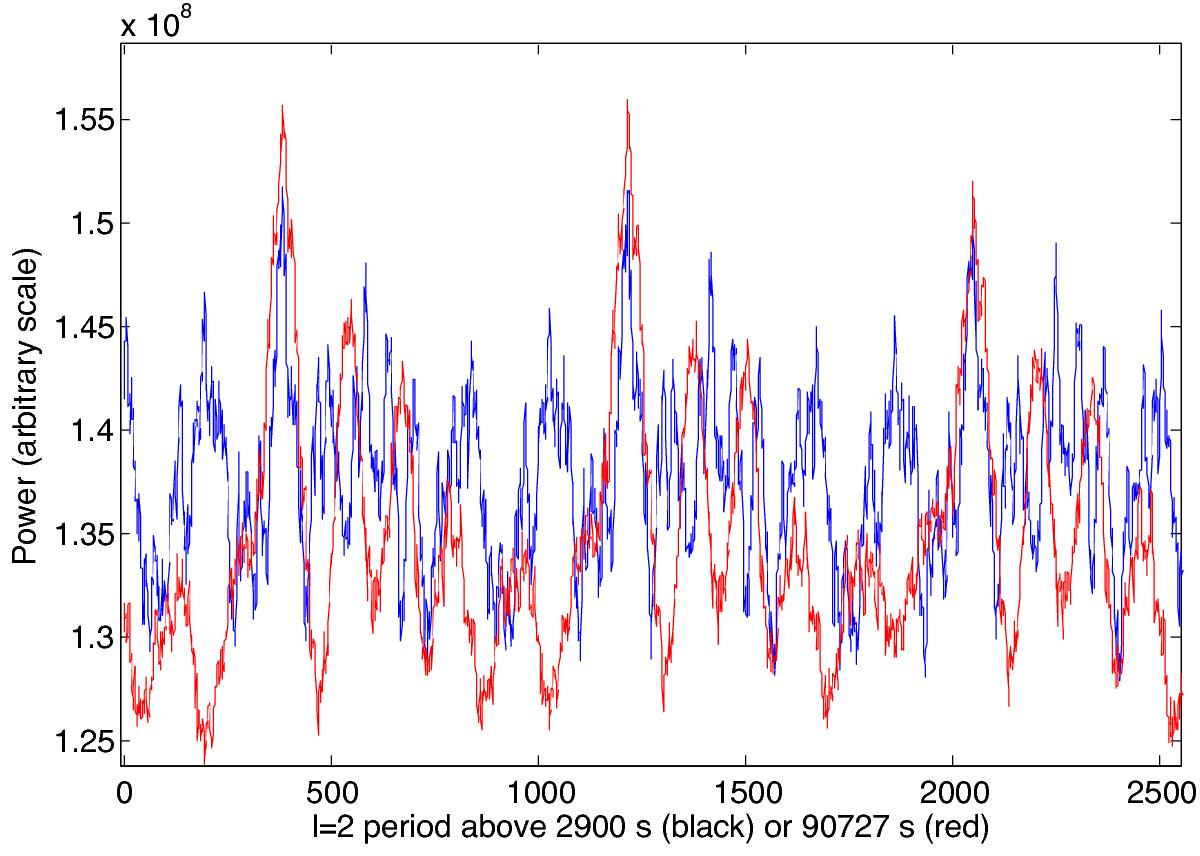
As in Fig. 32 for l = 1, this illustration for l = 2 uses two independent sequences of 56 intervals equidistant in period, the first half (shorter periods, ranging from n = −33 to −88) is plotted in blue and the second half (longer periods, ranging from n = −89 to −144, slightly rescaled) is shown in red, both computed on the complete time series of 16.5 years. The first three periods of each sequence are shown.
Current usage metrics show cumulative count of Article Views (full-text article views including HTML views, PDF and ePub downloads, according to the available data) and Abstracts Views on Vision4Press platform.
Data correspond to usage on the plateform after 2015. The current usage metrics is available 48-96 hours after online publication and is updated daily on week days.
Initial download of the metrics may take a while.