Free Access
Fig. 33
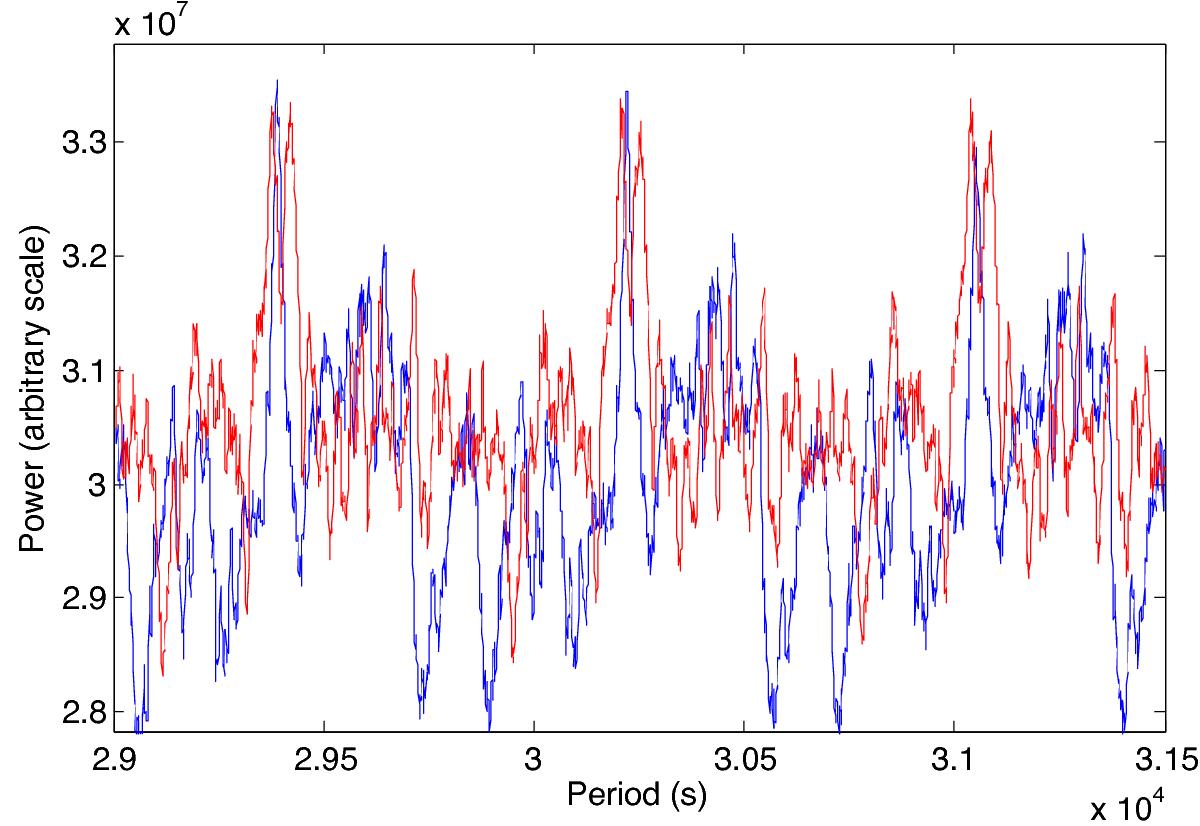
Figure to be compared to Fig. 27 for the l = 2g modes, computed for the same sequence of 112 layers of the power spectrum, equidistant in periods. This sum is computed here separately for the independent first half (red) and second half (blue) of the 16.5-year time series. The first three periods of each sequence are shown.
Current usage metrics show cumulative count of Article Views (full-text article views including HTML views, PDF and ePub downloads, according to the available data) and Abstracts Views on Vision4Press platform.
Data correspond to usage on the plateform after 2015. The current usage metrics is available 48-96 hours after online publication and is updated daily on week days.
Initial download of the metrics may take a while.