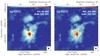
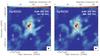
Fig. 8

Top panels: Sgr B2(N) ALMA continuum emission image at 242 GHz compared to the VLA 40 GHz continuum emission in contours (left panel; from Rolffs et al. 2011, and convolved to ![]() 4) and to the SMA 345 GHz in contours (right panel; from Qin et al. 2011; convolved to
4) and to the SMA 345 GHz in contours (right panel; from Qin et al. 2011; convolved to ![]() ). The contour levels are from 10% to 100% in steps of 20% and the intensity peak is 0.085 Jy beam-1, and from 5% to 100% in steps of 20% and the intensity peak is 2.82 Jy beam-1 for the VLA and SMA images, respectively. Bottom panels: same as in the top panels for Sgr B2(M). The contour levels are from 2% to 100% in steps of 20% and the intensity peak is 0.62 Jy beam-1, and from 5% to 100% in steps of 20% and the intensity peak is 3.41 Jy beam-1 for the VLA and SMA images, respectively. In all panels, the crosses indicate the position of the continuum sources listed in Tables 1 and 2.
). The contour levels are from 10% to 100% in steps of 20% and the intensity peak is 0.085 Jy beam-1, and from 5% to 100% in steps of 20% and the intensity peak is 2.82 Jy beam-1 for the VLA and SMA images, respectively. Bottom panels: same as in the top panels for Sgr B2(M). The contour levels are from 2% to 100% in steps of 20% and the intensity peak is 0.62 Jy beam-1, and from 5% to 100% in steps of 20% and the intensity peak is 3.41 Jy beam-1 for the VLA and SMA images, respectively. In all panels, the crosses indicate the position of the continuum sources listed in Tables 1 and 2.
Current usage metrics show cumulative count of Article Views (full-text article views including HTML views, PDF and ePub downloads, according to the available data) and Abstracts Views on Vision4Press platform.
Data correspond to usage on the plateform after 2015. The current usage metrics is available 48-96 hours after online publication and is updated daily on week days.
Initial download of the metrics may take a while.