Fig. B.1
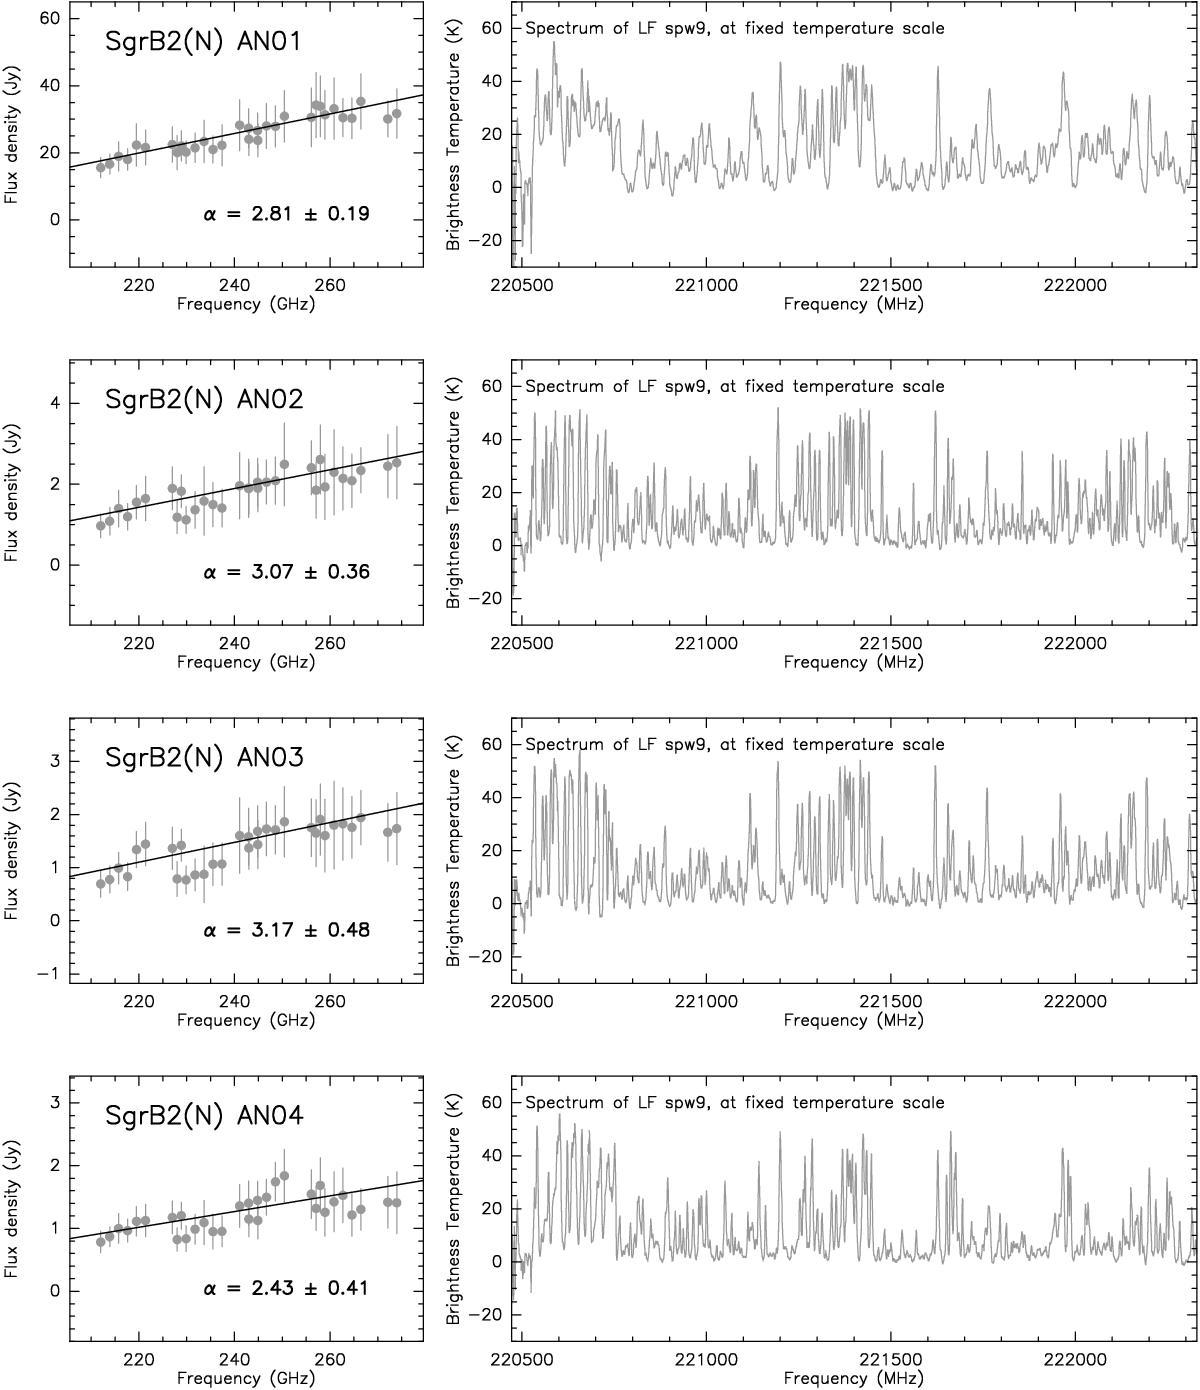
Left: Sgr B2(N) spectral density distributions for the ALMA continuum sources shown in Fig. 4 and listed in Table 1. Each gray dot corresponds to the integrated flux over the area of each source, when the flux is above the 3σ detection threshold. The fluxes at different frequencies are listed in Table B.1. The solid line is a linear fit to the data, with α corresponding to the spectral index (Sν ∝ να). Right: averaged spectrum over the 3σ-level polygon that defines the source, corresponding to the frequency range 211–213 GHz. The intensity scale of the top panel is adjusted to show the line features better, while the scale in the bottom panel was fixed for all the sources to show the relative brightness of the spectral lines between sources.
Current usage metrics show cumulative count of Article Views (full-text article views including HTML views, PDF and ePub downloads, according to the available data) and Abstracts Views on Vision4Press platform.
Data correspond to usage on the plateform after 2015. The current usage metrics is available 48-96 hours after online publication and is updated daily on week days.
Initial download of the metrics may take a while.