Fig. A.3
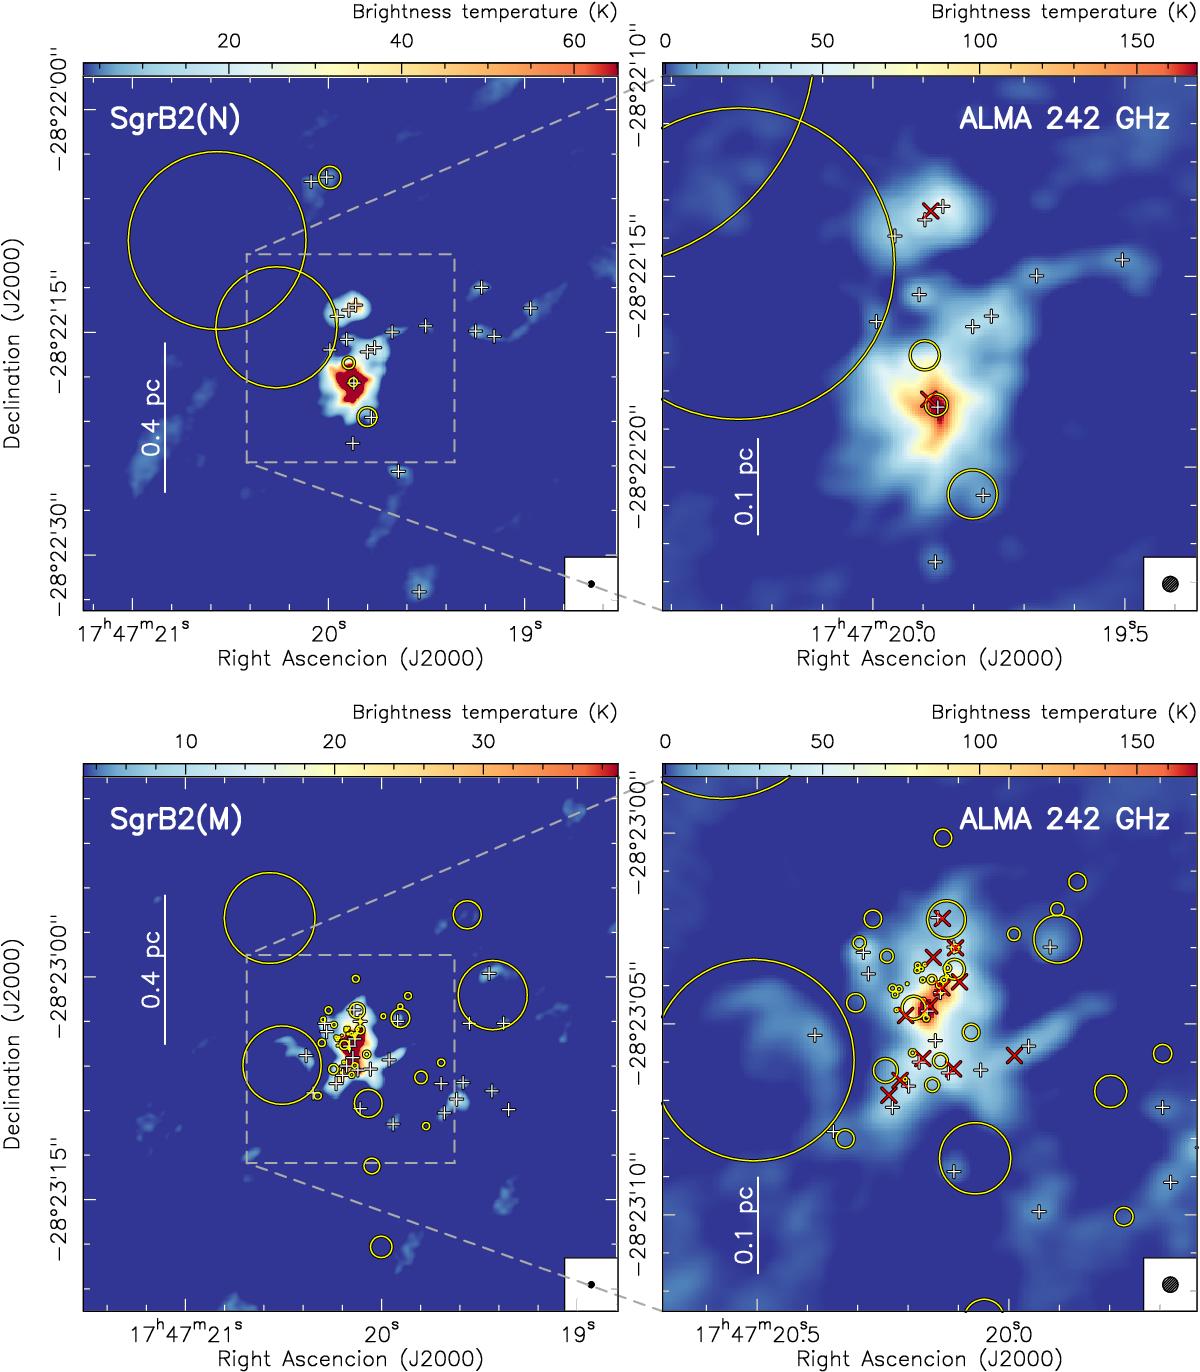
Finding charts of the different known continuum sources in Sgr B2(N) (top panels) and Sgr B2(M) (bottom panels). The yellow circles indicate well-known Hii regions (see Schmiedeke et al. 2016 and references therein), while the red crosses show the position of the sub-millimeter sources identified by Qin et al. (2011). The association of the ALMA sources with the Hii regions and sub-millimeter sources is summarized in Table 4.
Current usage metrics show cumulative count of Article Views (full-text article views including HTML views, PDF and ePub downloads, according to the available data) and Abstracts Views on Vision4Press platform.
Data correspond to usage on the plateform after 2015. The current usage metrics is available 48-96 hours after online publication and is updated daily on week days.
Initial download of the metrics may take a while.