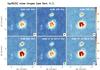
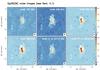
Fig. A.2

Noise maps for Sgr B2(N) (top panels) and Sgr B2(M) (bottom panels) obtained from the determination of the continuum level, and after averaging the different noise maps produced for each spectral window. The central frequencies are indicated in each panel. The color bar is units of mJy beam-1, with a round synthesized beam of 0.̋4. See more details in Sect. 3.2 and Appendix A.
Current usage metrics show cumulative count of Article Views (full-text article views including HTML views, PDF and ePub downloads, according to the available data) and Abstracts Views on Vision4Press platform.
Data correspond to usage on the plateform after 2015. The current usage metrics is available 48-96 hours after online publication and is updated daily on week days.
Initial download of the metrics may take a while.