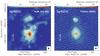
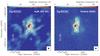
Fig. 12

Comparison of the ALMA continuum emission maps (left panels, see also Figs. 4 and 5) to synthetic images at 242 GHz (right panels) of the 3D radiative transfer model presented in Schmiedeke et al. (2016). The top panels show the emission toward Sgr B2(N), while the bottom panels show the emission toward Sgr B2(M). The synthetic images have been post-processed to the same uv sampling of the actual ALMA observations, adding thermal noise corresponding to a precipitable water vapor of 0.7 mm.
Current usage metrics show cumulative count of Article Views (full-text article views including HTML views, PDF and ePub downloads, according to the available data) and Abstracts Views on Vision4Press platform.
Data correspond to usage on the plateform after 2015. The current usage metrics is available 48-96 hours after online publication and is updated daily on week days.
Initial download of the metrics may take a while.