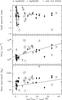
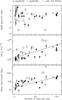
Fig. 11

Scatter plots showing the relation between the properties derived from the dust emission. Spectral index determined in the range 211–275 GHz (top panels), H2 column density (middle panels), and dust and gas mass (bottom panels) with respect to the percentage of line luminosity over the total luminosity (left column) and the number of lines per GHz (right column). Filled circles correspond to the sources identified in Sgr B2(N), while open circles show the sources found in Sgr B2(M). Gray symbols and stars indicate those ALMA continuum sources associated with VLA 40 GHz continuum emission. The solid lines in four panels correspond to linear fits to the black symbols in each panel (see more details in Sect. 4.3).
Current usage metrics show cumulative count of Article Views (full-text article views including HTML views, PDF and ePub downloads, according to the available data) and Abstracts Views on Vision4Press platform.
Data correspond to usage on the plateform after 2015. The current usage metrics is available 48-96 hours after online publication and is updated daily on week days.
Initial download of the metrics may take a while.