Fig. 10
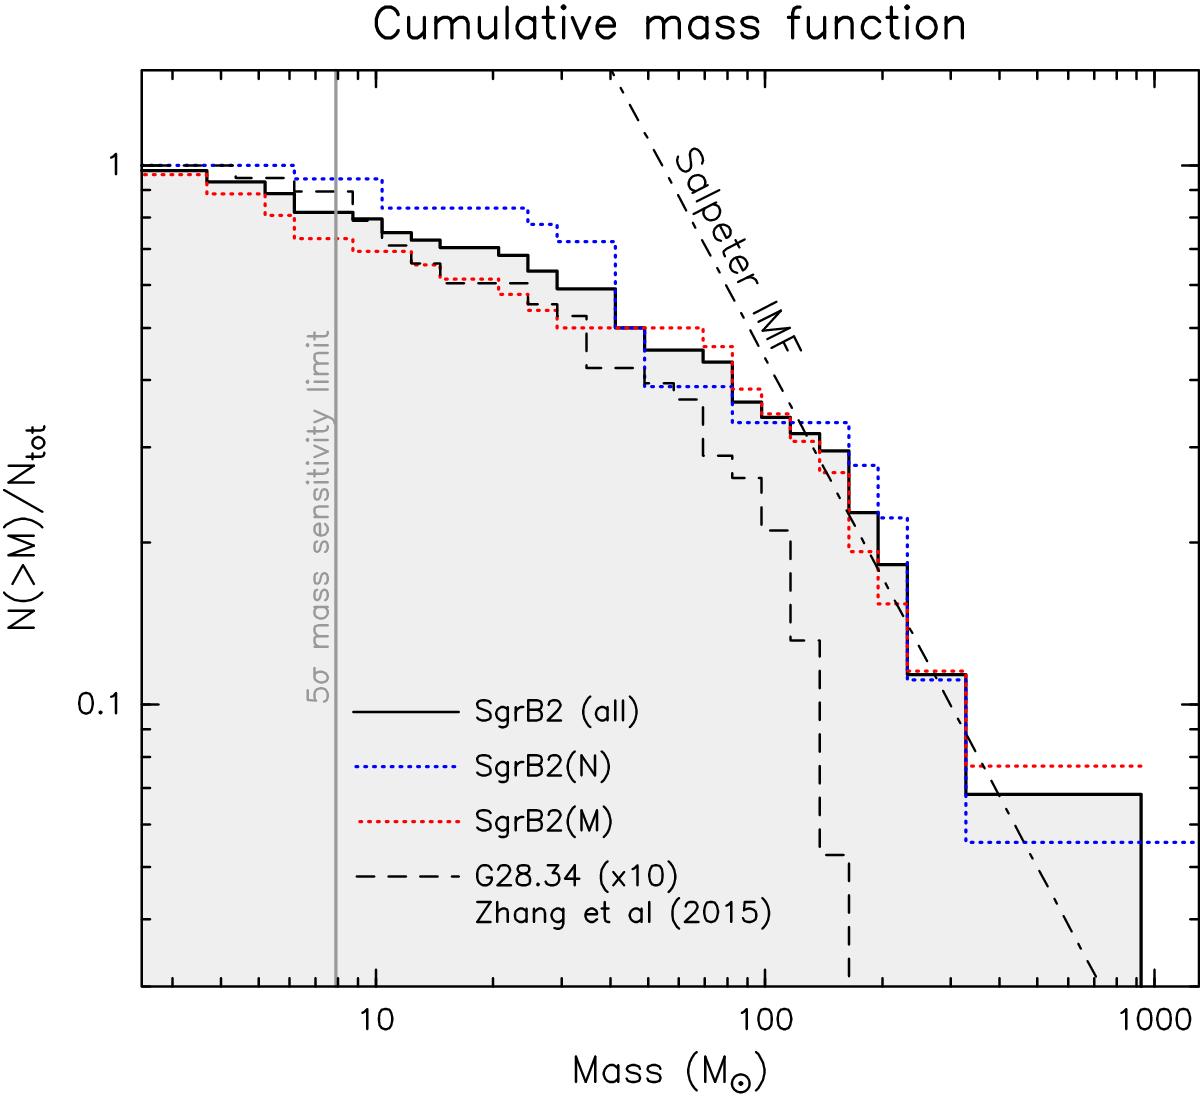
Cumulative mass function of the sources identified toward Sgr B2. The blue and red dotted lines correspond to the sources identified in Sgr B2(N) and Sgr B2(M), respectively. The dashed line shows the cumulative mass function of the fragments identified in the massive infrared dark cloud G28.34 by Zhang et al. (2015), scaled by a factor of 10 in mass. The dot-dashed line indicates the slope of the Salpeter initial mass funciton. The vertical gray line indicates the 5σ mass sensitivity limit of 7.9 M⊙ for a temperature of 100 K.
Current usage metrics show cumulative count of Article Views (full-text article views including HTML views, PDF and ePub downloads, according to the available data) and Abstracts Views on Vision4Press platform.
Data correspond to usage on the plateform after 2015. The current usage metrics is available 48-96 hours after online publication and is updated daily on week days.
Initial download of the metrics may take a while.