Fig. 5
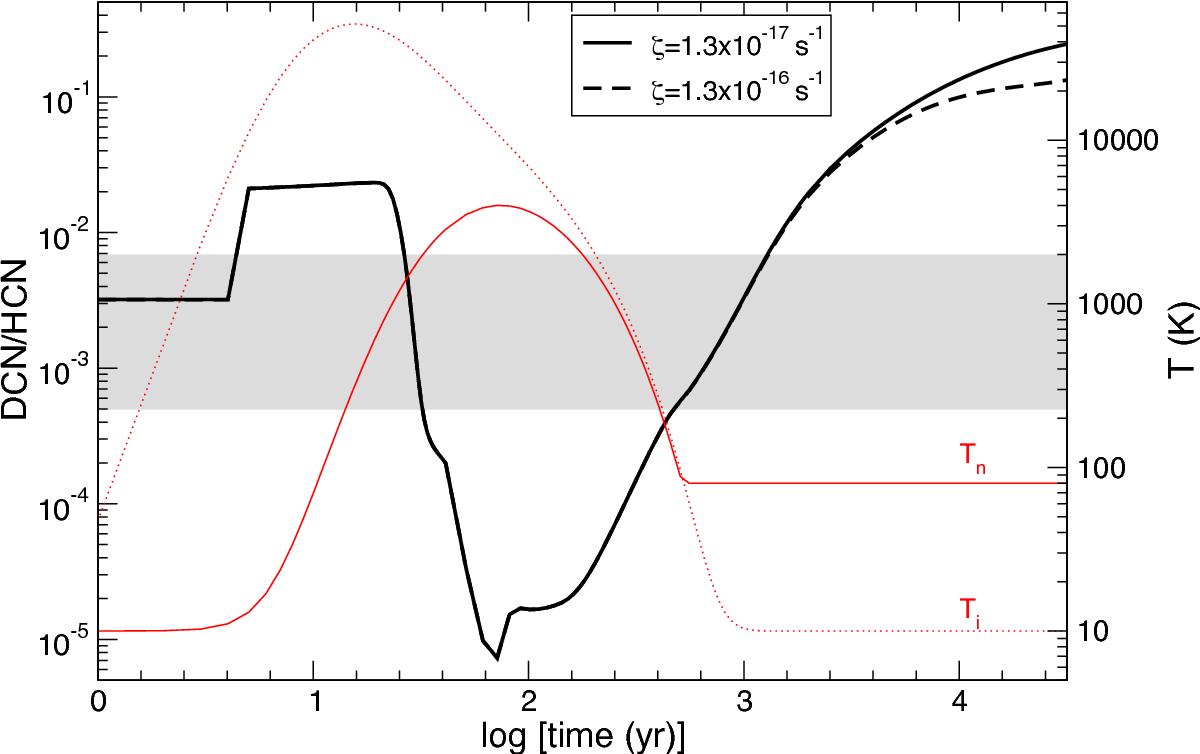
DCN/HCN abundance ratio in logarithmic scale as a function of time (Phase II) as predicted by our model with a pre-shock density of n(H2) = 105 cm-3 and a shock velocity vs = 40 km s-1. The thin red line displays the neutral gas temperature profile and the dotted red line the temperature of the ions. Black thick solid line depicts the model with the standard value of the cosmic ionization rate while the thick dashed-line shows the model with ζ = 1.3 × 10⁻¹⁶ s-1. The gray area shows the range of observed values.
Current usage metrics show cumulative count of Article Views (full-text article views including HTML views, PDF and ePub downloads, according to the available data) and Abstracts Views on Vision4Press platform.
Data correspond to usage on the plateform after 2015. The current usage metrics is available 48-96 hours after online publication and is updated daily on week days.
Initial download of the metrics may take a while.