Fig. 4
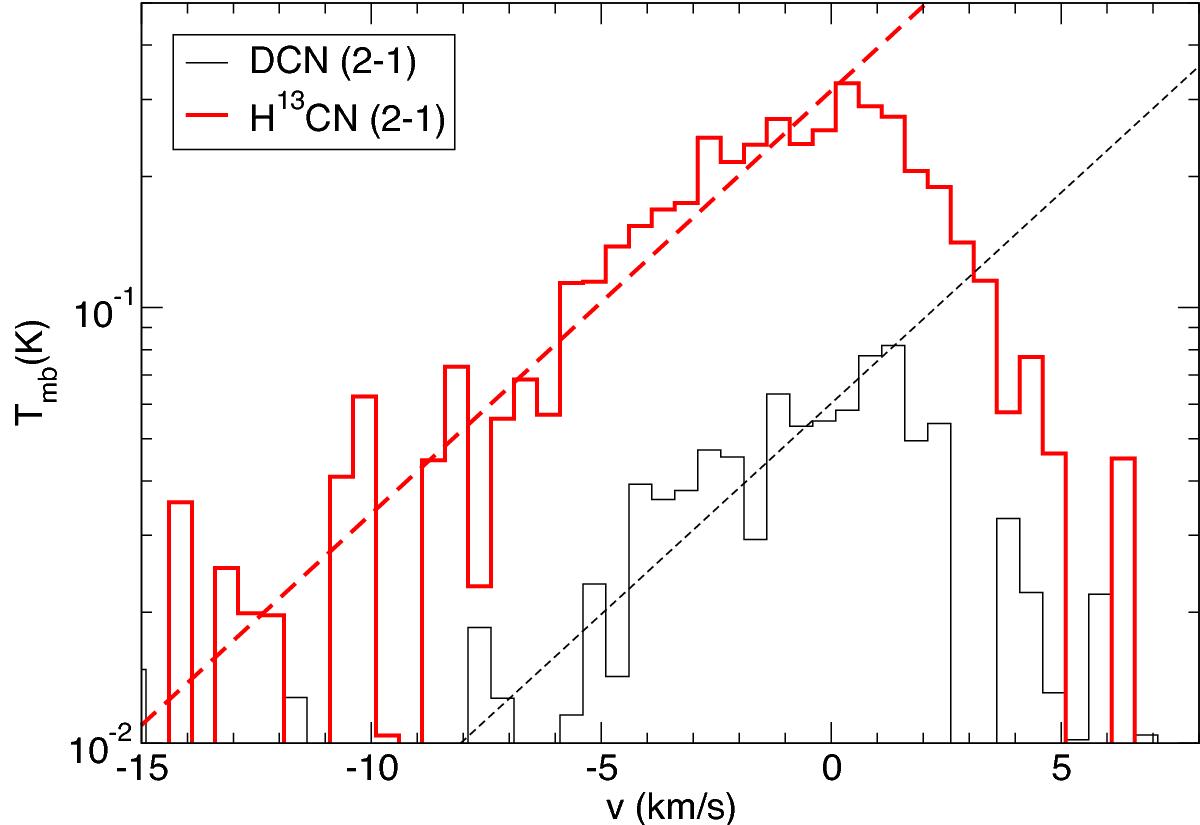
Spectral profile of DCN J = 2−1 (black thin line) and H13CN J = 2−1 (red thick line) extracted over the whole emitting region displayed in linear-logarithmic scale. The thin/thick dashed lines show the fit to the spectral slope Tmb ∝ exp(− | v/v0 |) for DCN and H13CN, respectively, with v0 = 4.4 km s-1, which corresponds to the signature of the g2 outflow component identified by Lefloch et al. (2012).
Current usage metrics show cumulative count of Article Views (full-text article views including HTML views, PDF and ePub downloads, according to the available data) and Abstracts Views on Vision4Press platform.
Data correspond to usage on the plateform after 2015. The current usage metrics is available 48-96 hours after online publication and is updated daily on week days.
Initial download of the metrics may take a while.