Fig. 2
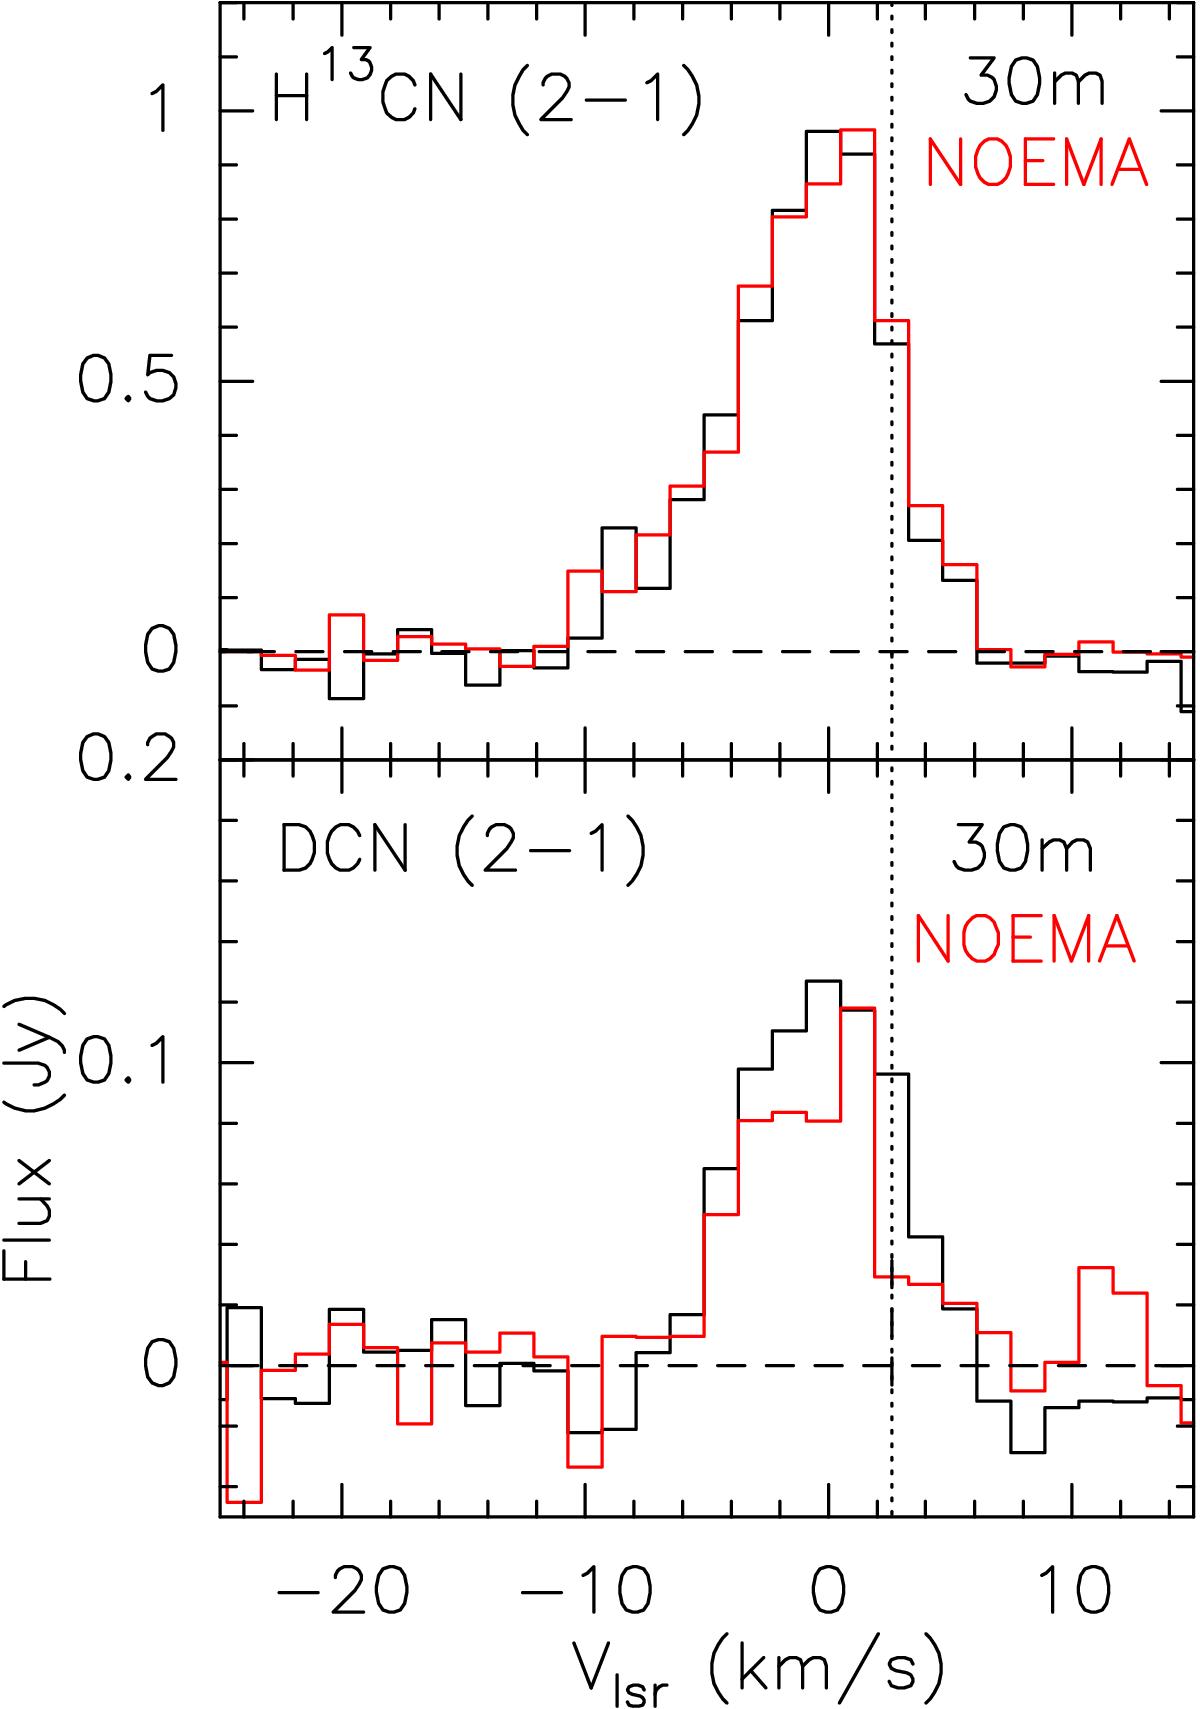
Top: spectrum of H13CN (2–1) obtained with the IRAM 30 m telescope (black histogram) toward L1157-B1, and NOEMA spectrum (red histogram) extracted from a circular region equal to the IRAM 30 m HPBW (![]() ). Bottom: same as top panel for DCN (2–1). In this case the IRAM 30 m HPBW is
). Bottom: same as top panel for DCN (2–1). In this case the IRAM 30 m HPBW is ![]() . All spectra have been smoothed to 1.4 km s-1 velocity resolution. The vertical dotted line depicts the systemic velocity vLSR = 2.6 km s-1.
. All spectra have been smoothed to 1.4 km s-1 velocity resolution. The vertical dotted line depicts the systemic velocity vLSR = 2.6 km s-1.
Current usage metrics show cumulative count of Article Views (full-text article views including HTML views, PDF and ePub downloads, according to the available data) and Abstracts Views on Vision4Press platform.
Data correspond to usage on the plateform after 2015. The current usage metrics is available 48-96 hours after online publication and is updated daily on week days.
Initial download of the metrics may take a while.