Fig. 1
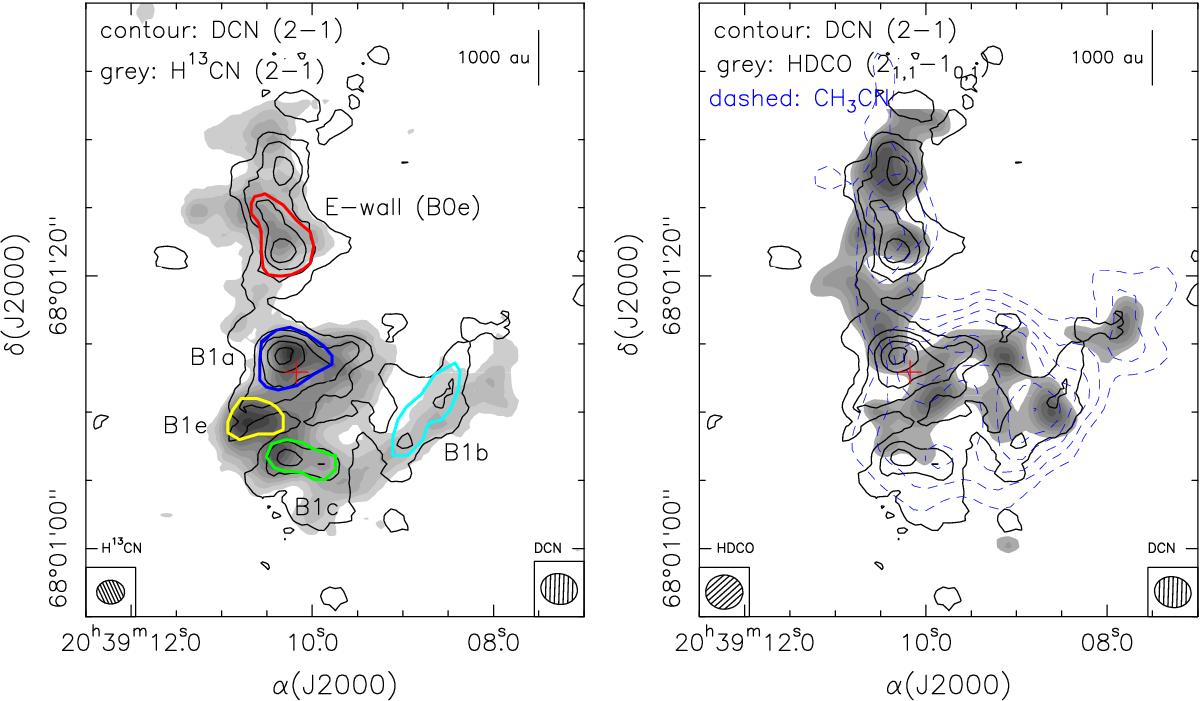
Left: integrated intensity map of H13CN (2–1) line (gray scale) and DCN (2–1) line (contours) observed with NOEMA. Gray-scale levels start at 10% of the peak and increase in steps of 10%. The contour levels range from 3 to 15 in steps of three times the rms noise of the map, 6.5 mJy beam-1 km s-1. Red, blue, yellow, green, and cyan lines depict the regions used to extract the spectra and compute Dfrac(HCN). These delineate the eastern wall (“E-wall” or B0e) of the cavity, B1a, B1e, the “head” of the bow-shock (B1c), and B1b, respectively. The synthesized beams of H13CN (2–1) and DCN (2–1) are shown in the bottom left and bottom right corner, respectively. Right: integrated intensity map of HDCO (21,1−10,1) line (gray scale, Fontani et al. 2014) and DCN (2–1) line using the same contour level as in the left panel. Gray-scale levels start at 40% of the HDCO peak and increase in steps of 10%. To highlight the bow-shock structure, we show the CH3CN (8–7) K = 0−2 image (blue-dashed contours) from Codella et al. (2009). The synthesized beams of HDCO (21,1−10,1) and DCN (2–1) are shown in the bottom left and bottom right corner, respectively. In both panels the red cross indicates the peak of the high-velocity SiO (2–1) emission (Gueth et al. 1998).
Current usage metrics show cumulative count of Article Views (full-text article views including HTML views, PDF and ePub downloads, according to the available data) and Abstracts Views on Vision4Press platform.
Data correspond to usage on the plateform after 2015. The current usage metrics is available 48-96 hours after online publication and is updated daily on week days.
Initial download of the metrics may take a while.