Fig. B.1
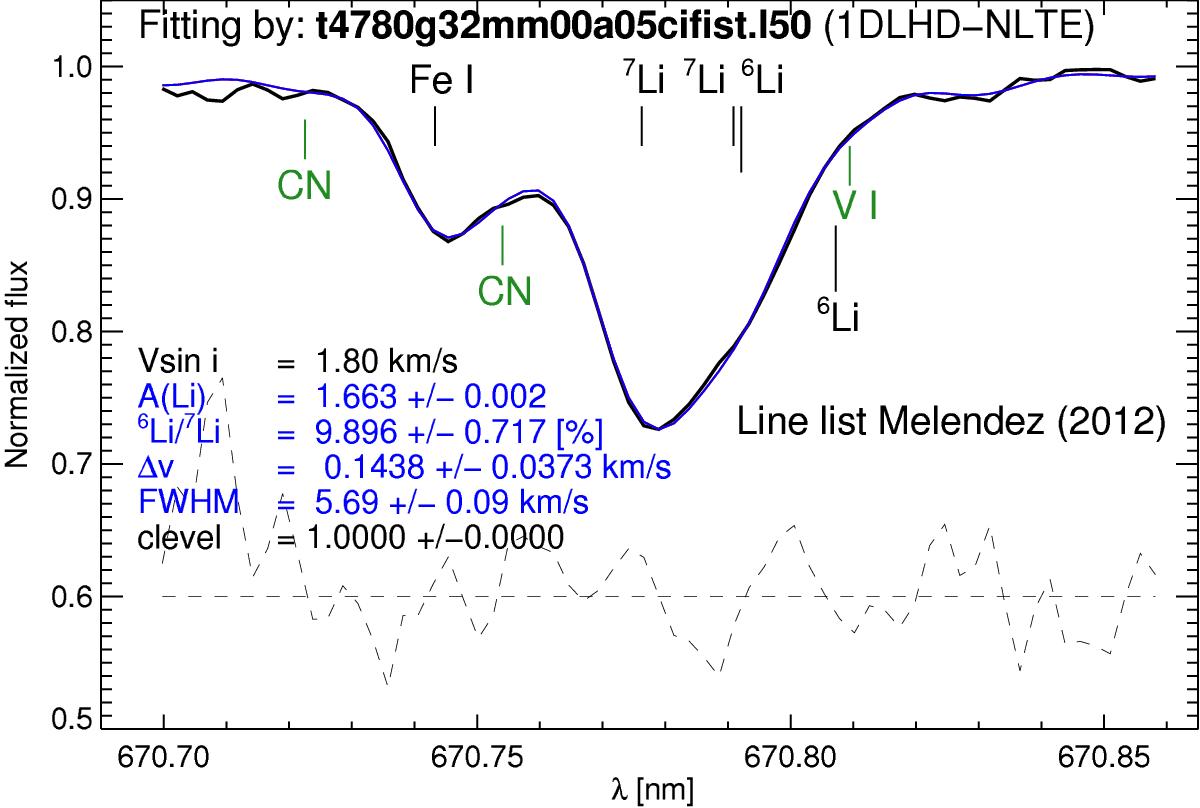
1D NLTE best-fit of the CFHT spectrum using the 1D LHD model a of Table 1 and the list of atomic and molecular data M12, modified to account for the new log gf value measured by Lawler et al. (2014) for the V i blend line. For the synthetic spectra, we assumed an enhancement in A(C) by + 0.06 dex with respect to the solar value. The wavelength positions of the V i line and of the main contribution to the CN band are indicated in green.
Current usage metrics show cumulative count of Article Views (full-text article views including HTML views, PDF and ePub downloads, according to the available data) and Abstracts Views on Vision4Press platform.
Data correspond to usage on the plateform after 2015. The current usage metrics is available 48-96 hours after online publication and is updated daily on week days.
Initial download of the metrics may take a while.