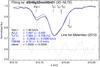
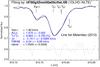
Fig. 7

Best fit (thin blue line) to the CFHT spectrum (black line) obtained with line list M12+L14 in the Full range setup. a) The fit with the 3D NLTE model A and b) the respective 1D NLTE fit with model a. The four free parameters controlled during the fit are highlighted in the plot legend in blue, whereas vsini and the level of the continuum were kept fixed. The residuals (dashed lines) are enhanced by a factor of ten for better visibility, and offset by + 0.6 units in flux. The uncertainties are the formal 1σ internal fitting errors for the given S/N = 400 of the CFHT spectrum.
Current usage metrics show cumulative count of Article Views (full-text article views including HTML views, PDF and ePub downloads, according to the available data) and Abstracts Views on Vision4Press platform.
Data correspond to usage on the plateform after 2015. The current usage metrics is available 48-96 hours after online publication and is updated daily on week days.
Initial download of the metrics may take a while.