Fig. 4
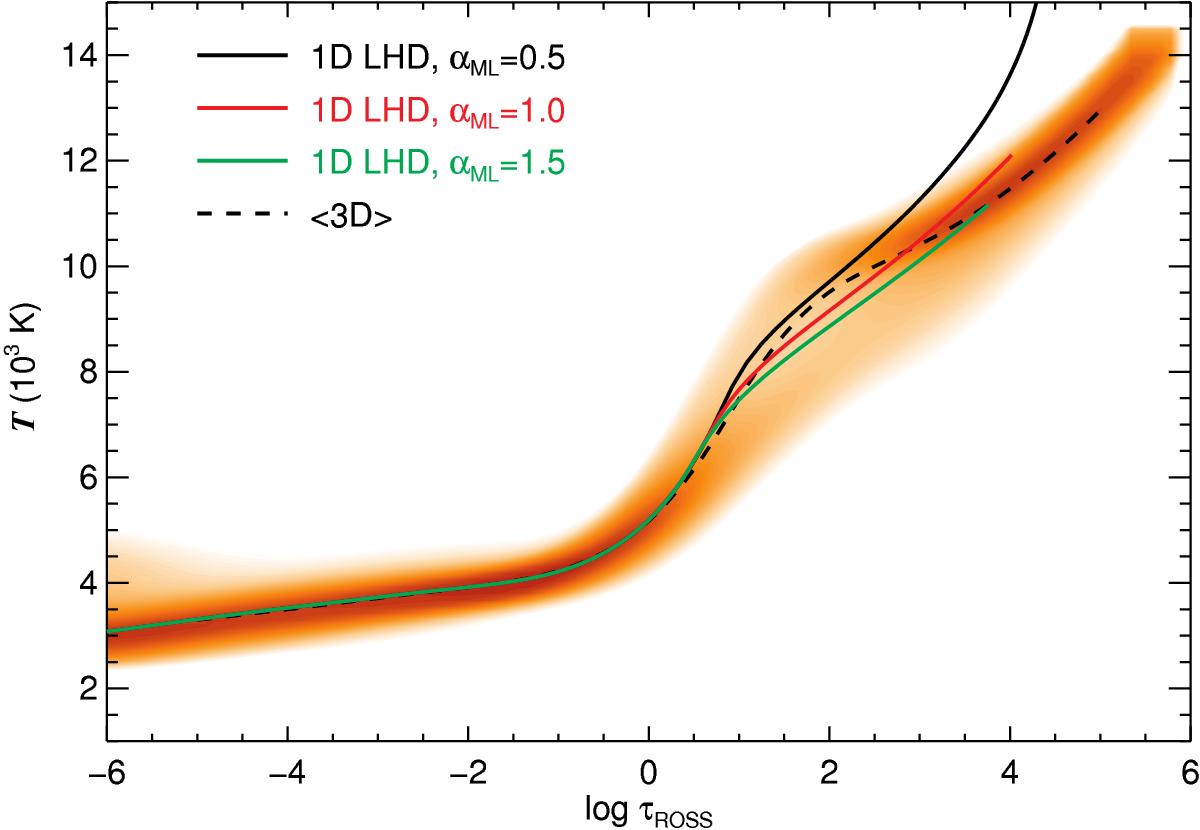
Temperature structure of our 3D and 1D models on the Rosseland optical depth scale τROSS. The adopted 3D model A (Table 1) is shown as a probability density distribution (orange). The ⟨ 3D ⟩ mean model is obtained by averaging the 20 snapshots of the 3D model over surfaces of equal Rosseland optical depth (black dashed line). The three 1D LHD models with αMLT = 0.5 (black), 1.0 (red), and 1.5 (green) are shown as solid lines. The 3D model reveals photospheric temperature fluctuations in layers of fixed τROSS of several 100 K (darker shaded regions are indicative of more likely temperatures).
Current usage metrics show cumulative count of Article Views (full-text article views including HTML views, PDF and ePub downloads, according to the available data) and Abstracts Views on Vision4Press platform.
Data correspond to usage on the plateform after 2015. The current usage metrics is available 48-96 hours after online publication and is updated daily on week days.
Initial download of the metrics may take a while.