Fig. 3
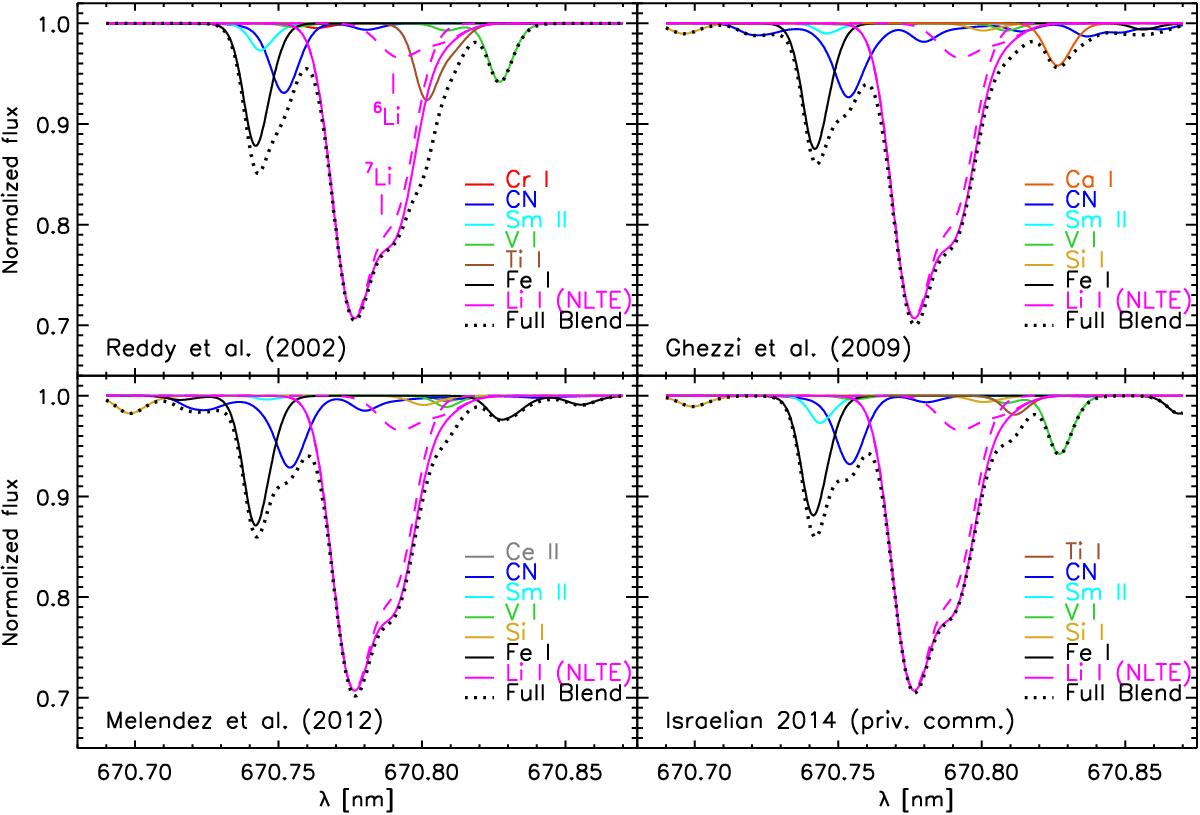
Visualization of the four line lists used for the grid of synthetic Li line profiles (flux). Each chemical species is synthesized in 3D separately and shown in a different color for easy identification. We adopted model A of Table 1 with parameters closest to what was found by Strassmeier et al. (2011). The lithium line (magenta, dashed lines showing the contributions due to 6Li and 7Li) is computed in NLTE, whereas we assumed LTE for the blend lines. The full blend is shown as the dotted black line. No further broadening, except the 3D hydro-velocity field arising from the convective motions, has been applied to the spectra. The line lists differ in wavelength positions and log gf-values, and in some cases even in the chemical element assigned to a particular line, especially in the critical red wing of the Li doublet where the 6Li components lie.
Current usage metrics show cumulative count of Article Views (full-text article views including HTML views, PDF and ePub downloads, according to the available data) and Abstracts Views on Vision4Press platform.
Data correspond to usage on the plateform after 2015. The current usage metrics is available 48-96 hours after online publication and is updated daily on week days.
Initial download of the metrics may take a while.