Fig. 2
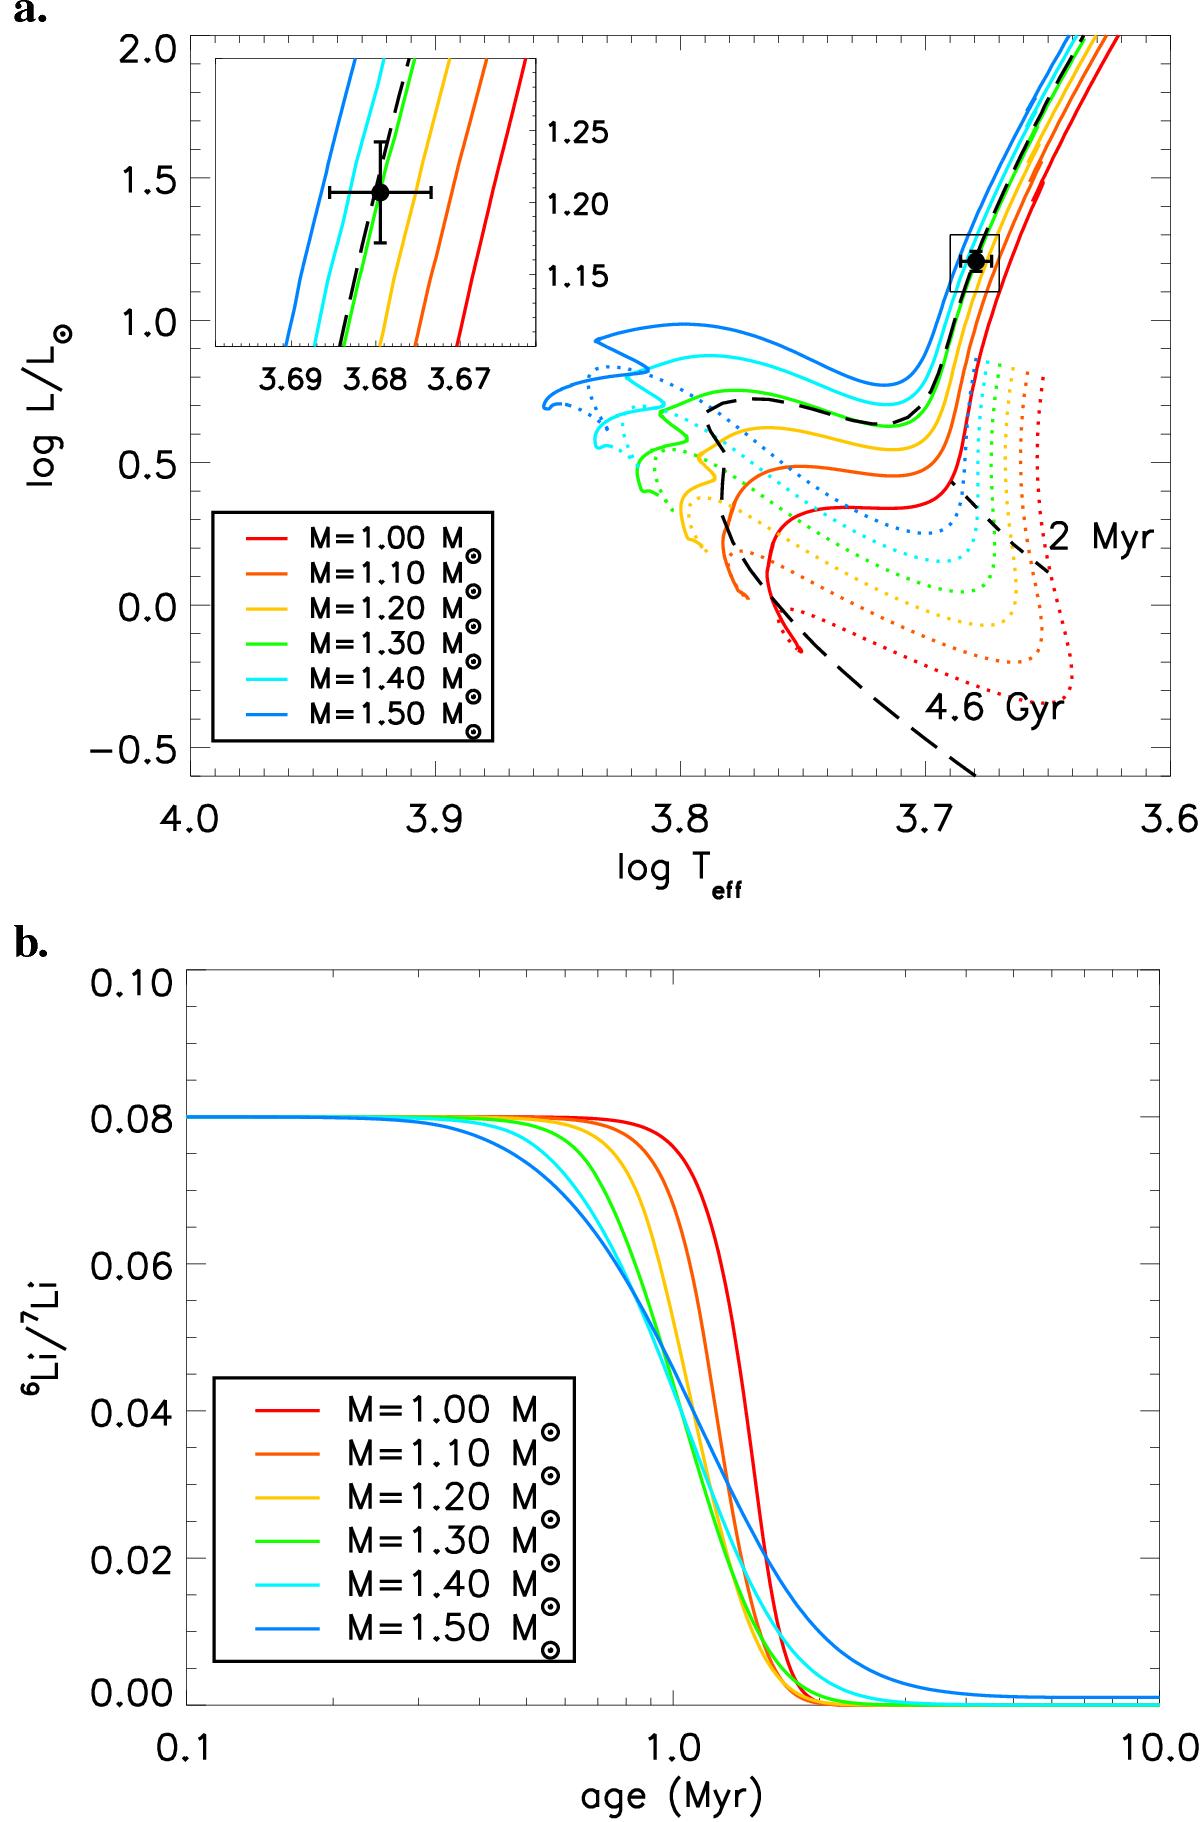
a) Position of the target star in the HR diagram compared with evolutionary tracks and isochrones of solar metallicity. Tracks are shown in dotted (pre-MS) and solid (main sequence onwards) colored lines; isochrones at 2 Myr and 4.6 Gyr are plotted as short-dashed and long-dashed black lines, respectively. b) 6Li/7Li ratio as a function of age for the same models showing that 6Li is completely destroyed within approximately the first two million years of pre-MS evolution.
Current usage metrics show cumulative count of Article Views (full-text article views including HTML views, PDF and ePub downloads, according to the available data) and Abstracts Views on Vision4Press platform.
Data correspond to usage on the plateform after 2015. The current usage metrics is available 48-96 hours after online publication and is updated daily on week days.
Initial download of the metrics may take a while.