Fig. A.2
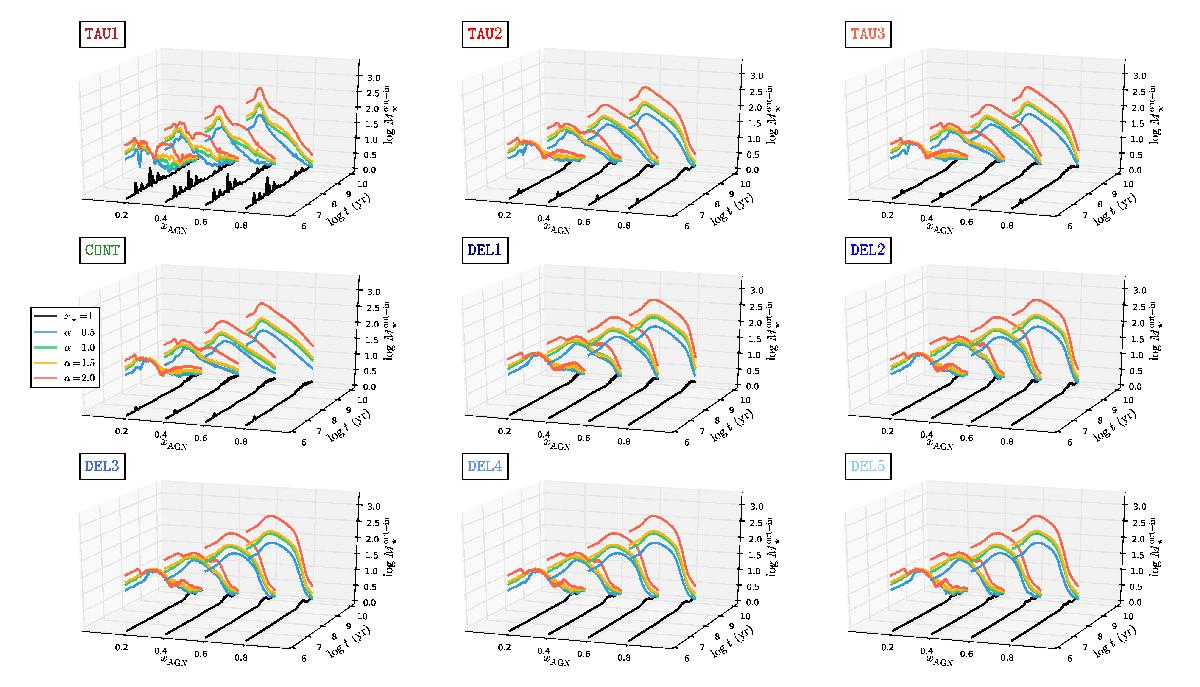
Difference in the stellar mass M⋆ (z-axis) between PSS and ESS values as a function of model age t (y-axis) and AGN fractional contribution xAGN (x-axis). Black, blue, green, yellow, and red lines represent CSP models and active galaxy models with α = 0.5, 1.0, 1.5, and 2.0, respectively. Each panel corresponds to different SFHs (see Fig. 1 for label details).
Current usage metrics show cumulative count of Article Views (full-text article views including HTML views, PDF and ePub downloads, according to the available data) and Abstracts Views on Vision4Press platform.
Data correspond to usage on the plateform after 2015. The current usage metrics is available 48-96 hours after online publication and is updated daily on week days.
Initial download of the metrics may take a while.