Fig. 10

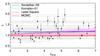
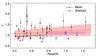
Left: polytropic index for the objects in our sample vs. concentration: γ increases with larger values of cNFW. Black points are the observed data points; the green and blue lines are the results of Komatsu & Seljak (2001) and Ascasibar et al. (2006), respectively; the red line with pink shaded area is the best fit using classical least squares minimization with 1σ confidence region; and the magenta line with lily shaded area is the best fit using an MCMC algorithm. Right: polytropic index for all clusters as a function of redshift. The data are better fitted by a linear relation: the effective polytropic index grows with redshift. Black points indicate the observed data points and the red line with pink shaded area indicates the best fit with 1σ dispersion using MCMC algorithm. The empty circles indicate the value of adiabatic index using the mean result for the clusters in each bin; the empty squares indicate the polytropic index of the stacked profiles in each redshift bin; the brown dashed line and dash-dotted magenta line indicate the best linear fit on the “mean” and “stacked” adiabatic index. The parameters describing these lines are listed in Table 3.
Current usage metrics show cumulative count of Article Views (full-text article views including HTML views, PDF and ePub downloads, according to the available data) and Abstracts Views on Vision4Press platform.
Data correspond to usage on the plateform after 2015. The current usage metrics is available 48-96 hours after online publication and is updated daily on week days.
Initial download of the metrics may take a while.