Fig. 8
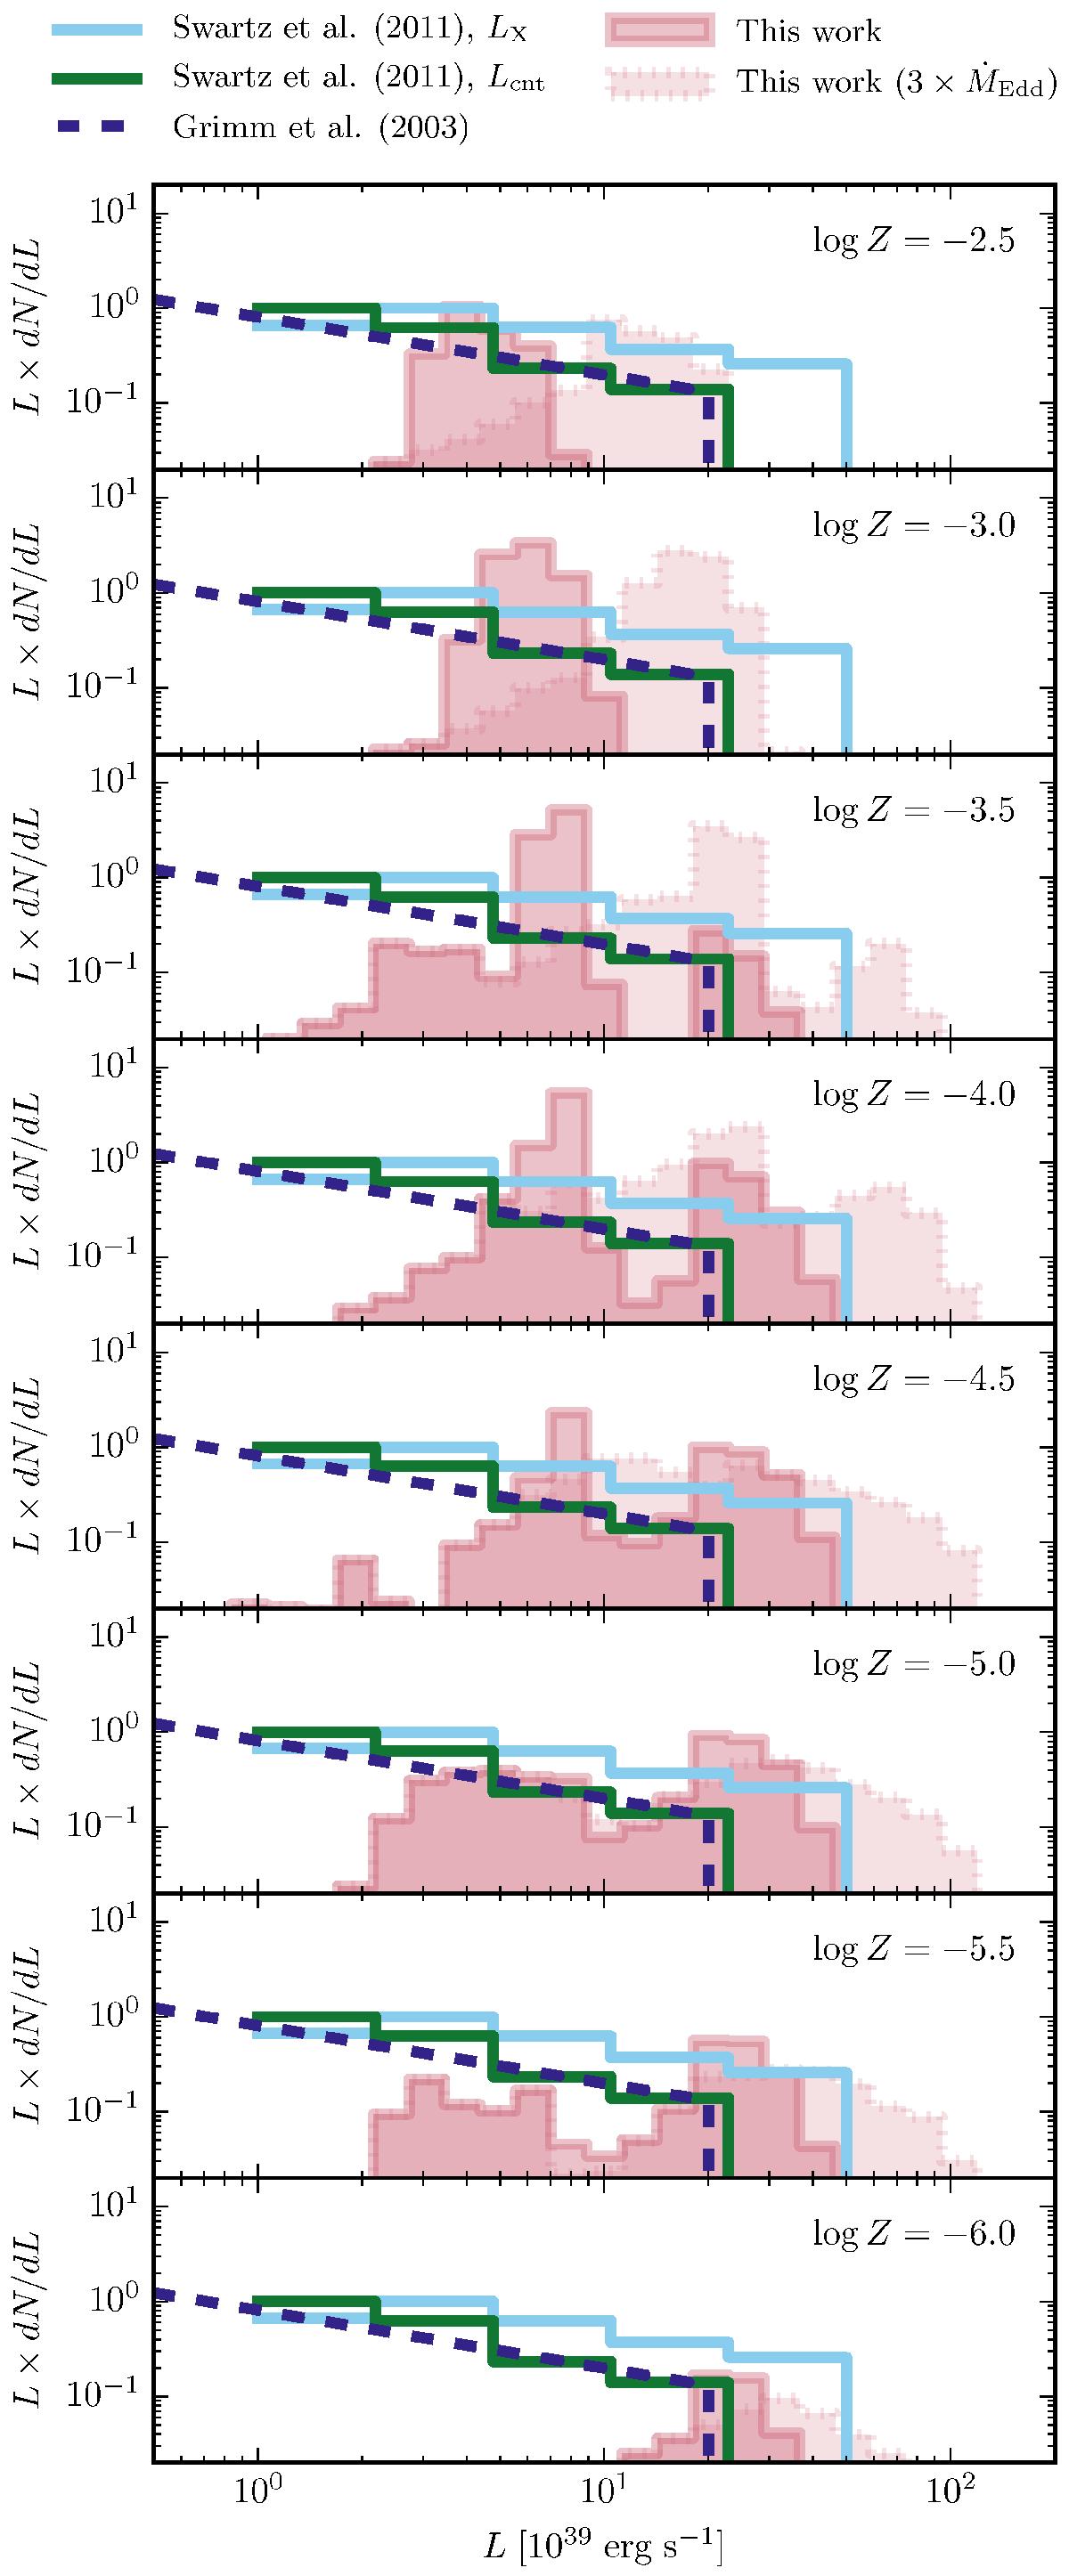
Expected luminosity distribution function for ULXs formed through CHE compared to the empirical distribution with a slope α = −1.6 derived by Grimm et al. (2003) and the sample of 117 ULXs from nearby galaxies described by Swartz et al. (2011), both of which cover metallicities log Z > −3.0. For the sample of Swartz et al. (2011) we include the distributions considering their estimates on source luminosities from spectral modelling LX, and that from number of counts Lcnt. All distributions are normalized to a star formation rate of 1 M⊙ yr-1.
Current usage metrics show cumulative count of Article Views (full-text article views including HTML views, PDF and ePub downloads, according to the available data) and Abstracts Views on Vision4Press platform.
Data correspond to usage on the plateform after 2015. The current usage metrics is available 48-96 hours after online publication and is updated daily on week days.
Initial download of the metrics may take a while.