Fig. C.1
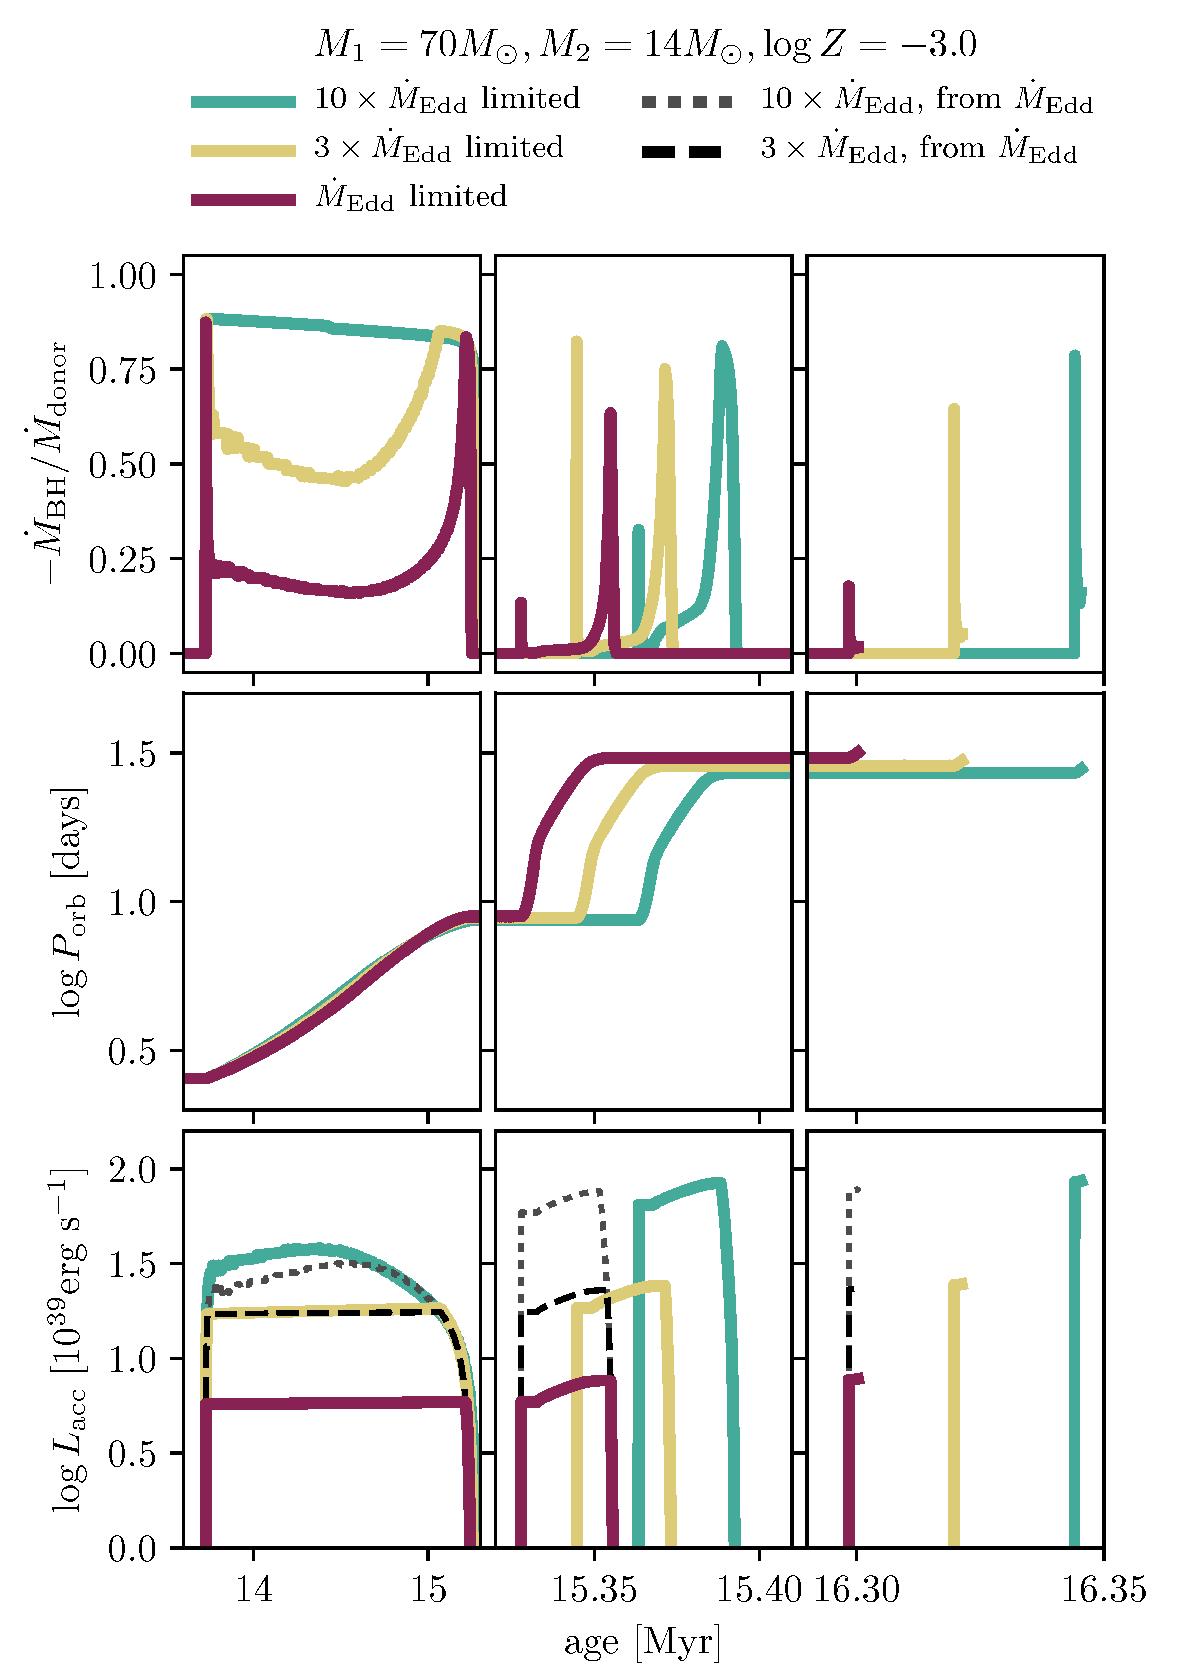
Zoom-in on the three mass transfer phases of the ULX model at metallicity log Z = −3.0 shown in Fig. 7, including simulations where the Eddington limit was increased by factors of 3 and 10. Dashed and dotted lines show the estimated luminosity that simulations with increased Eddington factors would have, using the potential luminosity a source could reach in the simulation strictly limited to the Eddington rate. Top: Mass transfer efficiency. Middle: Orbital periods. Bottom: Accretion luminosity.
Current usage metrics show cumulative count of Article Views (full-text article views including HTML views, PDF and ePub downloads, according to the available data) and Abstracts Views on Vision4Press platform.
Data correspond to usage on the plateform after 2015. The current usage metrics is available 48-96 hours after online publication and is updated daily on week days.
Initial download of the metrics may take a while.