Fig. 5
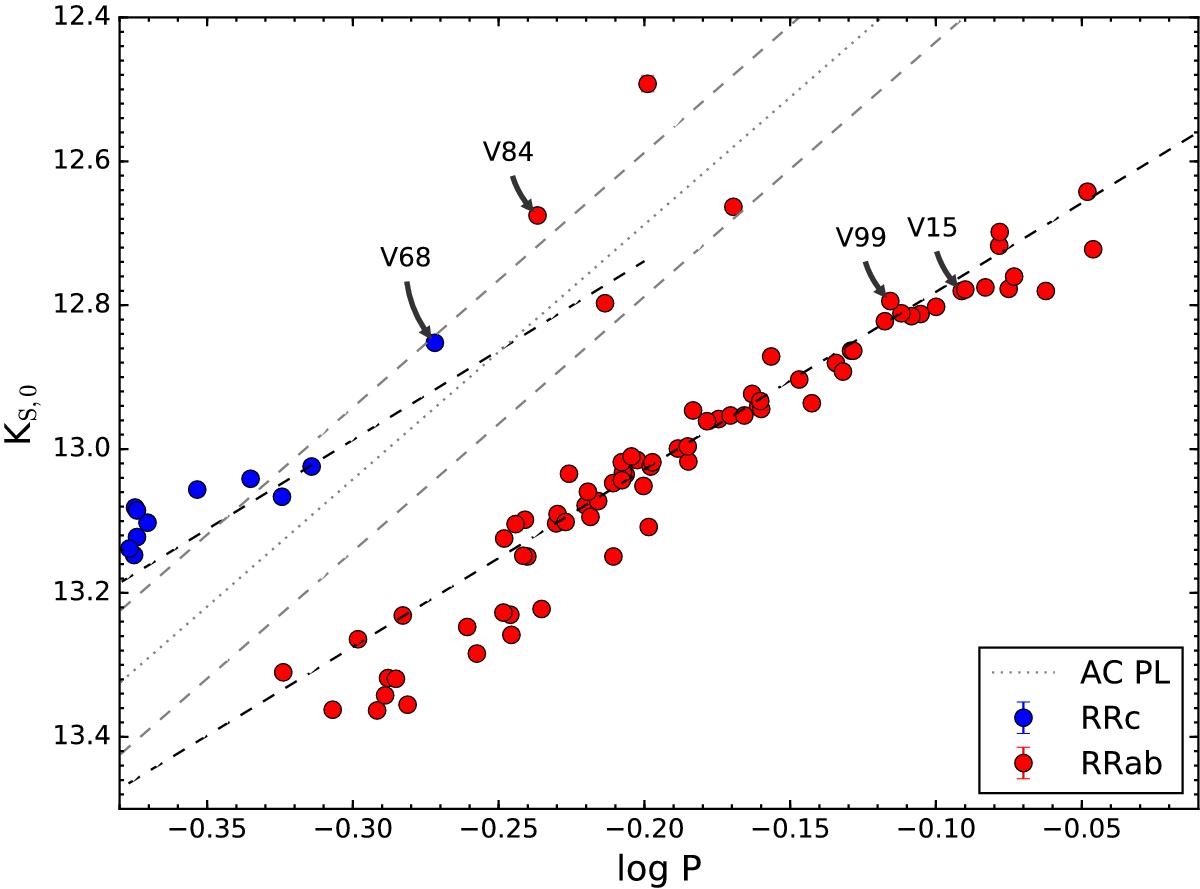
De-reddened KS magnitudes versus period around the locations of V68 and V84, two candidate ACEPs in ω Cen. The mean trend of RRab and RRc are denoted by the black dashed lines, whereas the dotted line shows the KS-PL relation for ACEPs, as derived by Ripepi et al. (2014a), shifted to the adopted distance modulus of μ0 = 13.708 mag. The gray dashed lines represent ± 0.1 mag deviations around the latter relation.
Current usage metrics show cumulative count of Article Views (full-text article views including HTML views, PDF and ePub downloads, according to the available data) and Abstracts Views on Vision4Press platform.
Data correspond to usage on the plateform after 2015. The current usage metrics is available 48-96 hours after online publication and is updated daily on week days.
Initial download of the metrics may take a while.