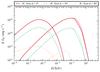
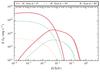
Fig. 5
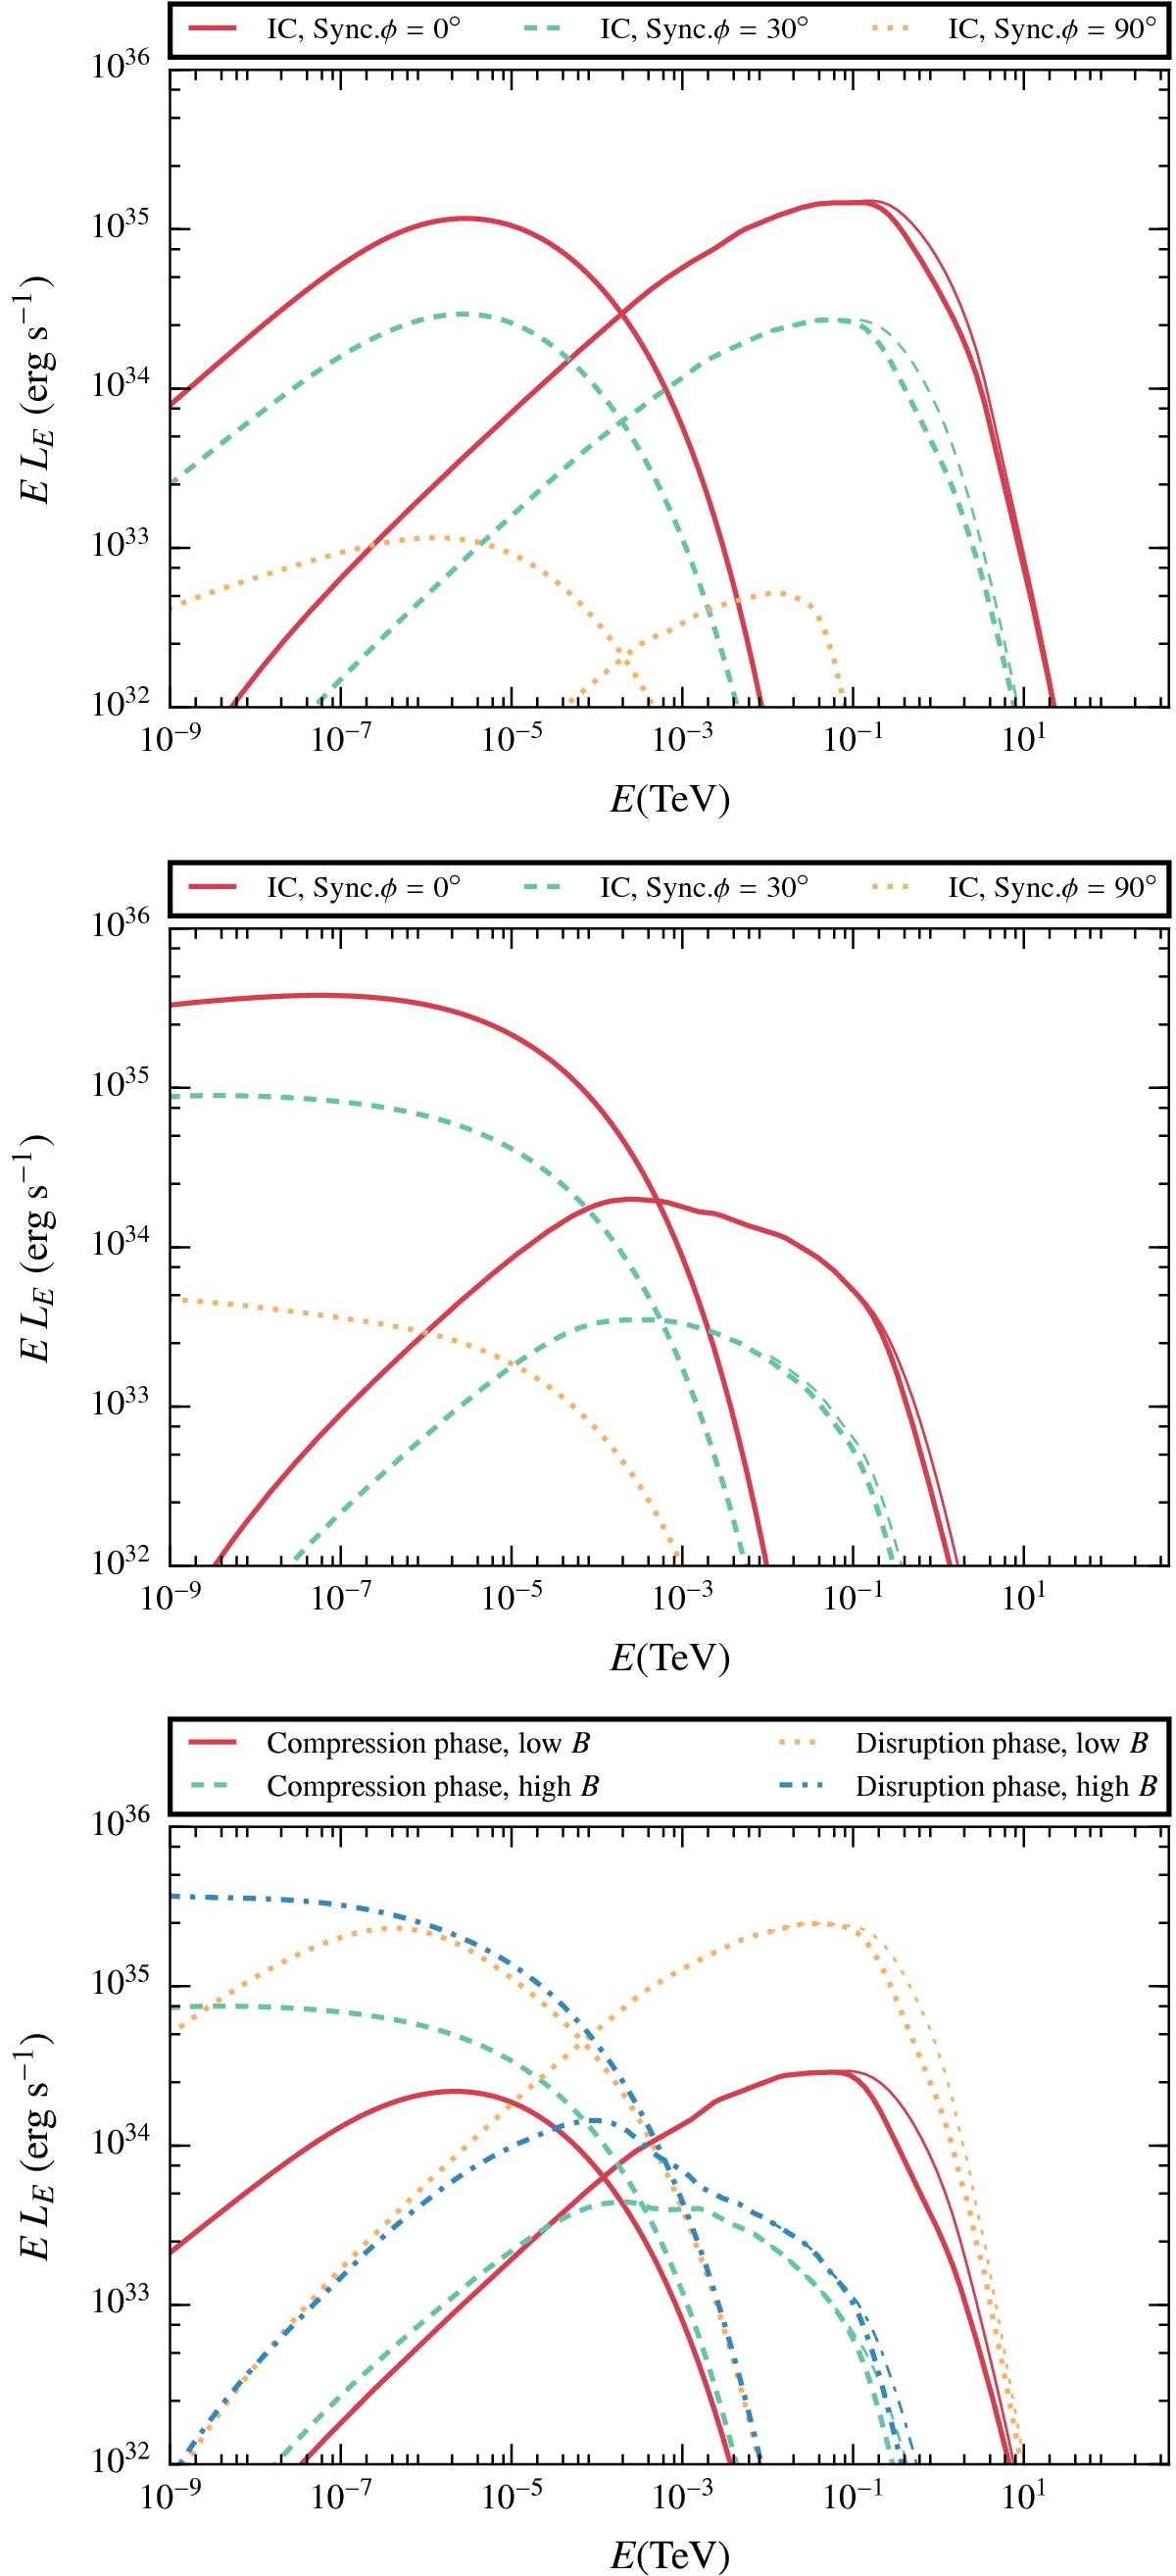
Top panel: synchrotron and IC SEDs for the compression phase φobs = 0, 30, and 90°, and χB = 10-3. The thin lines represent the emission without taking into account gamma-ray absorption due to electron-positron pair creation, i.e. the production SED. Middle panel: the same as for the top panel but for χB = 1. Bottom panel: a comparison between the SEDs of the compression and disruption phases.
Current usage metrics show cumulative count of Article Views (full-text article views including HTML views, PDF and ePub downloads, according to the available data) and Abstracts Views on Vision4Press platform.
Data correspond to usage on the plateform after 2015. The current usage metrics is available 48-96 hours after online publication and is updated daily on week days.
Initial download of the metrics may take a while.