Fig. 8
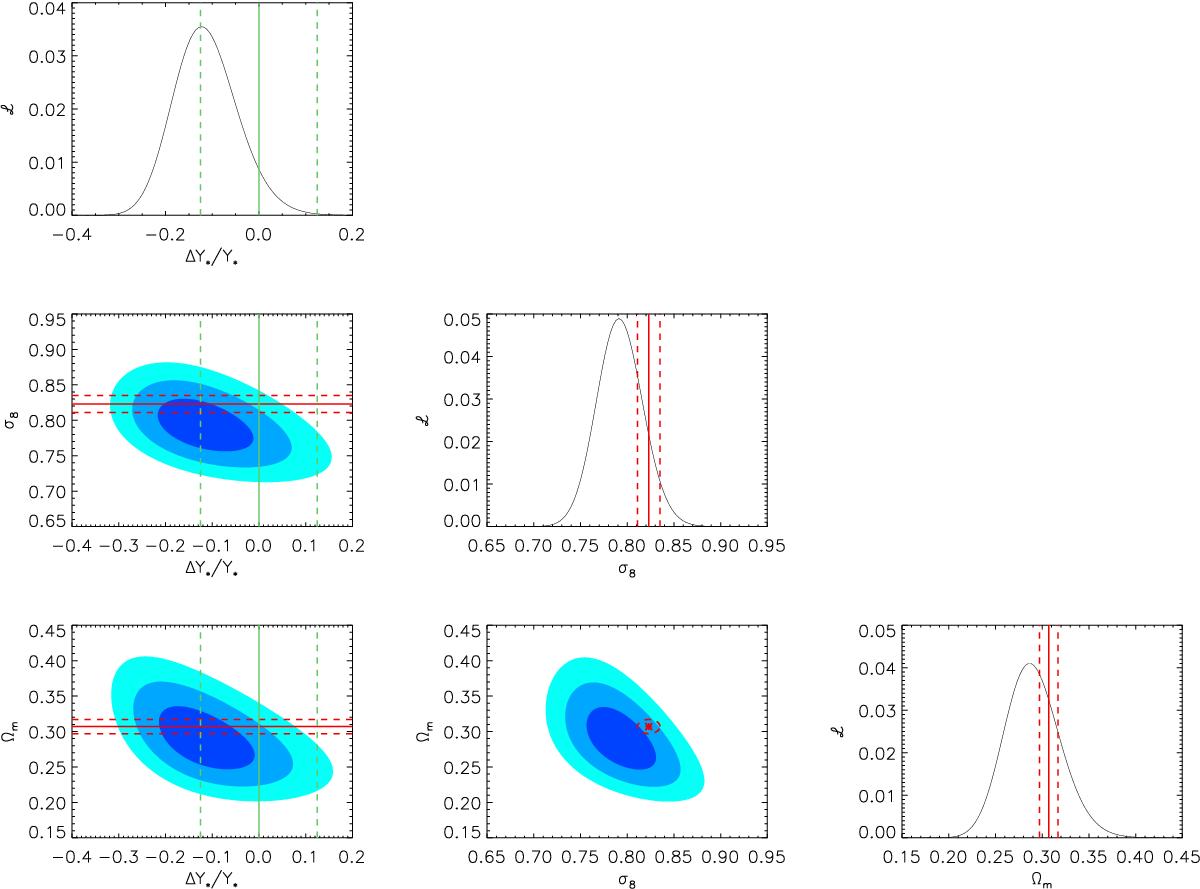
Likelihood function on Y⋆, Ωm, and σ8 derived from the combined analysis of galaxy cluster number count, tSZ power spectrum, and tSZ bispectrum. Blue contours indicates the 1, 2, and 3σ confidence levels. The red solid lines-sample shows the constraints from CMB power spectrum, the dashed red lines shows the 1σ confidence level. The solid green line shows (1−b) = 0.8 and the dashed green lines show (1−b) = 0.7 and (1−b) = 0.9.
Current usage metrics show cumulative count of Article Views (full-text article views including HTML views, PDF and ePub downloads, according to the available data) and Abstracts Views on Vision4Press platform.
Data correspond to usage on the plateform after 2015. The current usage metrics is available 48-96 hours after online publication and is updated daily on week days.
Initial download of the metrics may take a while.