Fig. A.2
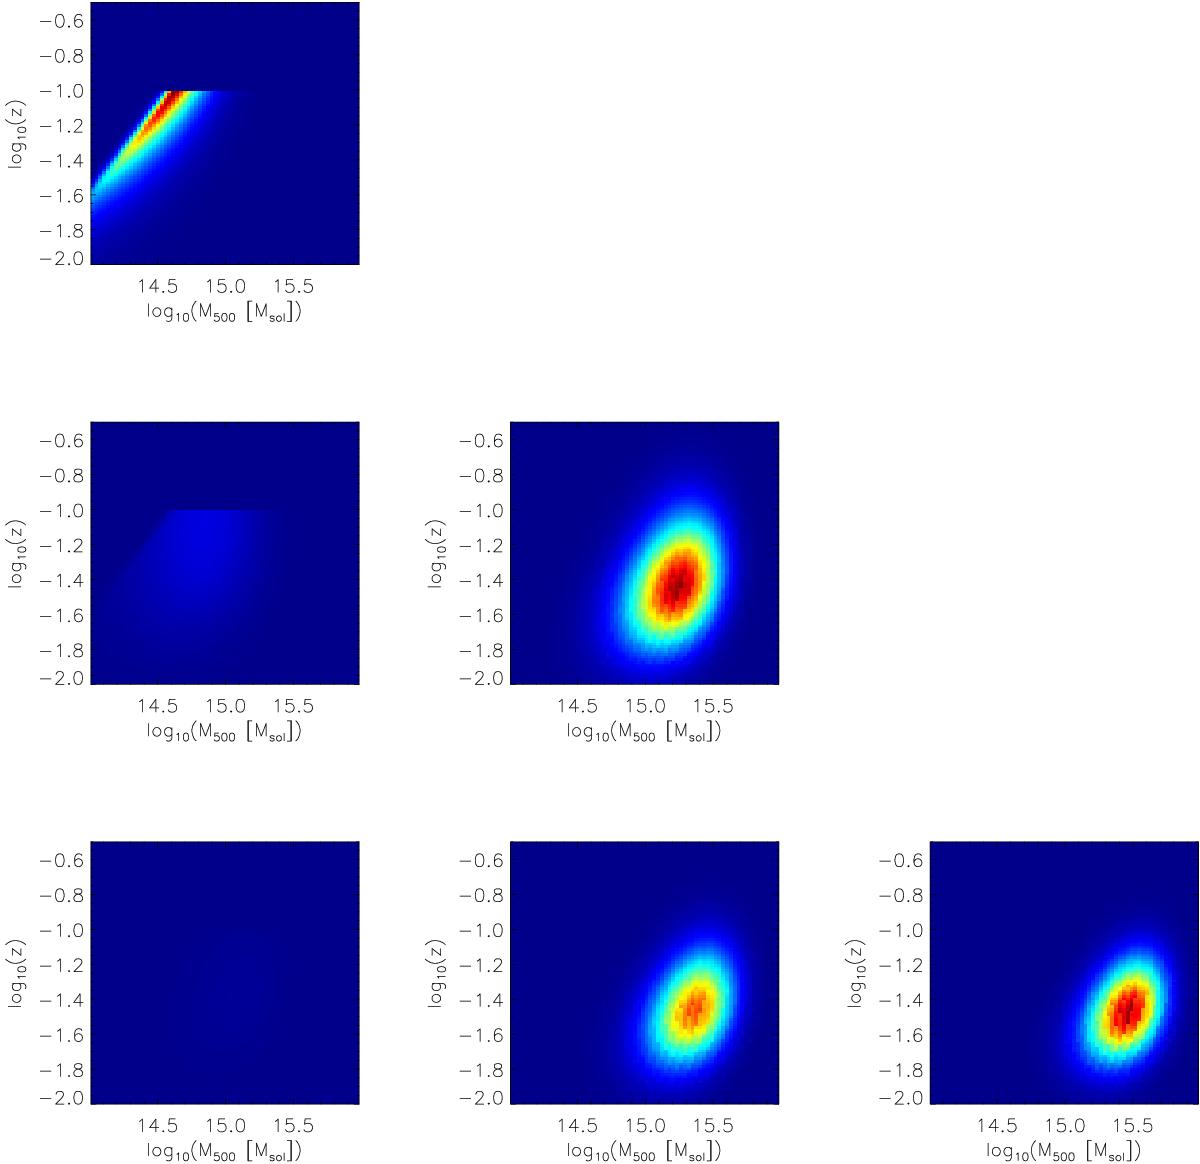
Covariance density, ![]() , as a function of halo mass, M500, and redshift, z. Number count is considered for z< 0.1, power spectrum and bispectrum are at at ℓ = 250. The plots are organized as for Fisher forecasts. On the diagonal are covariance density for the auto-probe variance, with from left to right: contribution to the variance of number counts, power spectrum and bispectrum. Off-diagonal plots represent cross-probes covariance density, with from left to right and top to bottom, covariance between: number counts and spectrum, number counts and bispectrum, and between power spectrum and bispectrum. The color scale is consistent between panels and represents the total amount of correlation between probes.
, as a function of halo mass, M500, and redshift, z. Number count is considered for z< 0.1, power spectrum and bispectrum are at at ℓ = 250. The plots are organized as for Fisher forecasts. On the diagonal are covariance density for the auto-probe variance, with from left to right: contribution to the variance of number counts, power spectrum and bispectrum. Off-diagonal plots represent cross-probes covariance density, with from left to right and top to bottom, covariance between: number counts and spectrum, number counts and bispectrum, and between power spectrum and bispectrum. The color scale is consistent between panels and represents the total amount of correlation between probes.
Current usage metrics show cumulative count of Article Views (full-text article views including HTML views, PDF and ePub downloads, according to the available data) and Abstracts Views on Vision4Press platform.
Data correspond to usage on the plateform after 2015. The current usage metrics is available 48-96 hours after online publication and is updated daily on week days.
Initial download of the metrics may take a while.