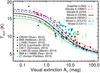
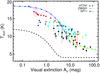
Fig. 8
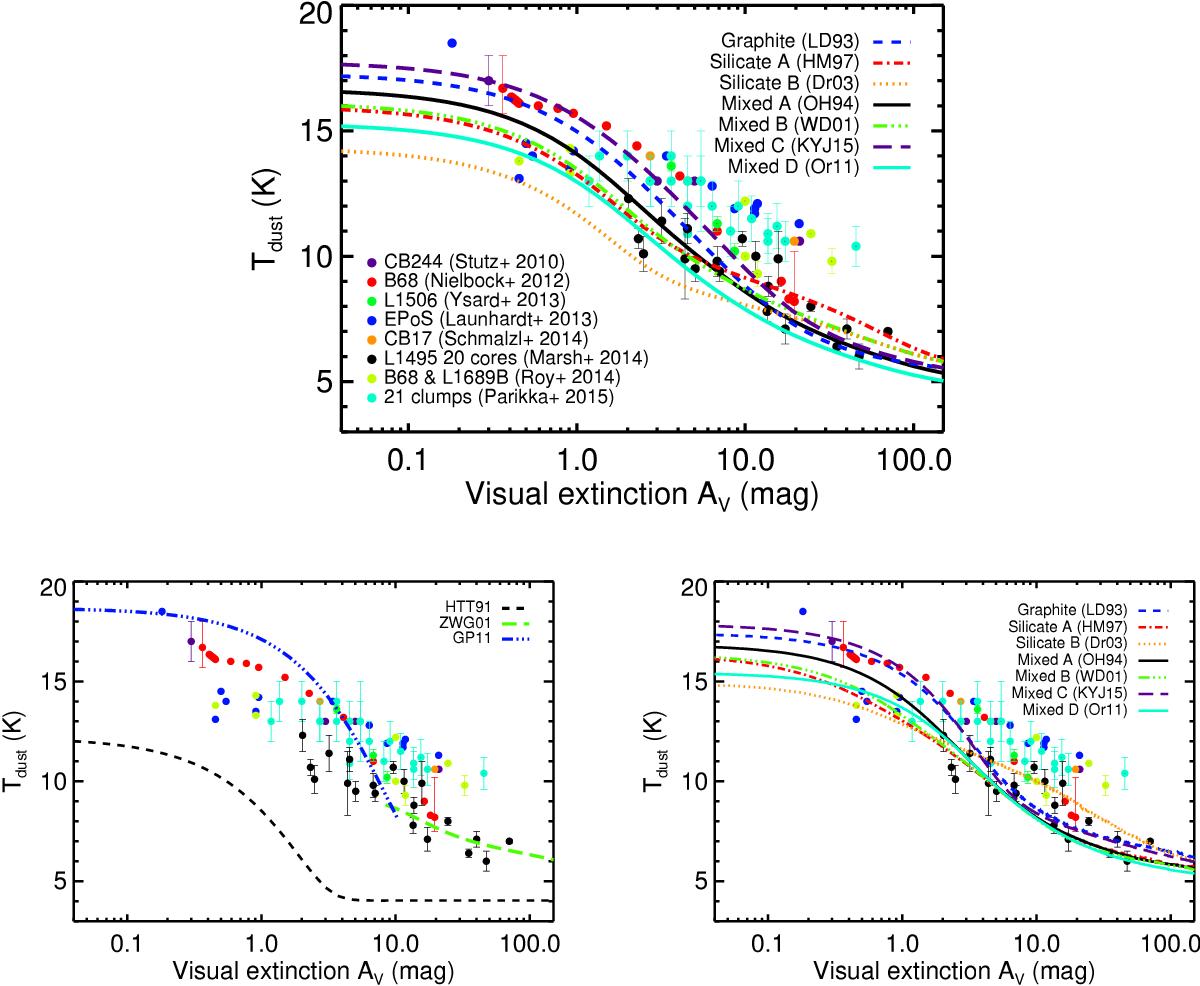
Dust temperature solutions compared against observations. Top panel displays the obtained dust temperatures from semi-analytical solutions (Sect. 5) for various grain materials, without ices. The bottom left panel shows the observed dust temperatures against three parametric expressions found in the literature (Appendix F). The bottom right panel compares the observed dust temperatures against the radmc-3d solutions (Sect. 6).
Current usage metrics show cumulative count of Article Views (full-text article views including HTML views, PDF and ePub downloads, according to the available data) and Abstracts Views on Vision4Press platform.
Data correspond to usage on the plateform after 2015. The current usage metrics is available 48-96 hours after online publication and is updated daily on week days.
Initial download of the metrics may take a while.