Fig. 2
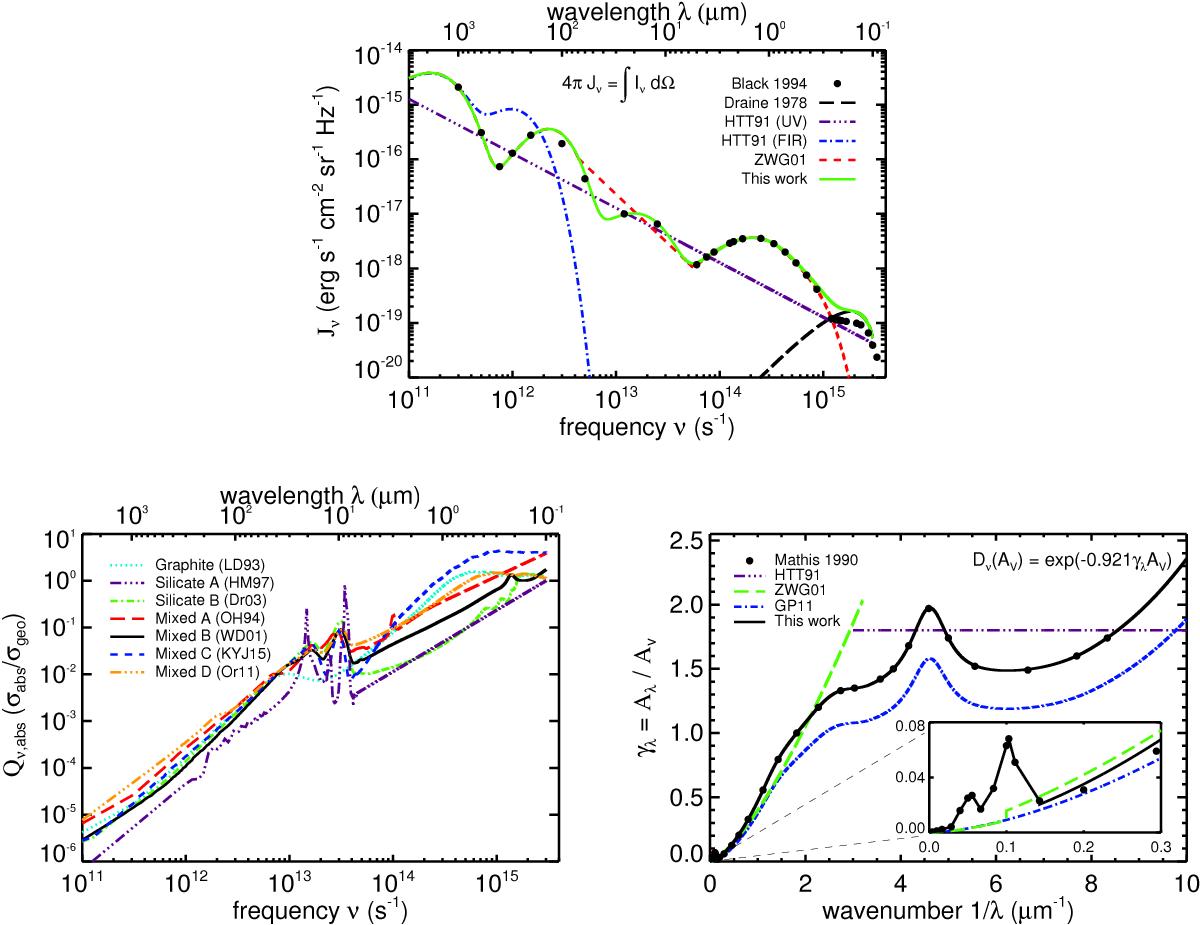
Parameters for the dust equilibrium. Top panel, the ISRF intensity as a function of frequency. The green line represents the adopted ISRF in this work. Bottom left panel, experimental and calculated absorption efficiencies for various grain materials. Scattering is not included in these. Bottom right panel, extinction curves from various studies. The filled black circles show the observed data from Mathis (1990). The black solid line is a fit to the data as given by Cardelli et al. (1989), which is adopted in this work. The sub panel zooms in at the lower wavenumbers where the adopted extinction curve below 0.15 μm-1, given by the black solid line, is interpolated from Mathis (1990).
Current usage metrics show cumulative count of Article Views (full-text article views including HTML views, PDF and ePub downloads, according to the available data) and Abstracts Views on Vision4Press platform.
Data correspond to usage on the plateform after 2015. The current usage metrics is available 48-96 hours after online publication and is updated daily on week days.
Initial download of the metrics may take a while.