Fig. E.1
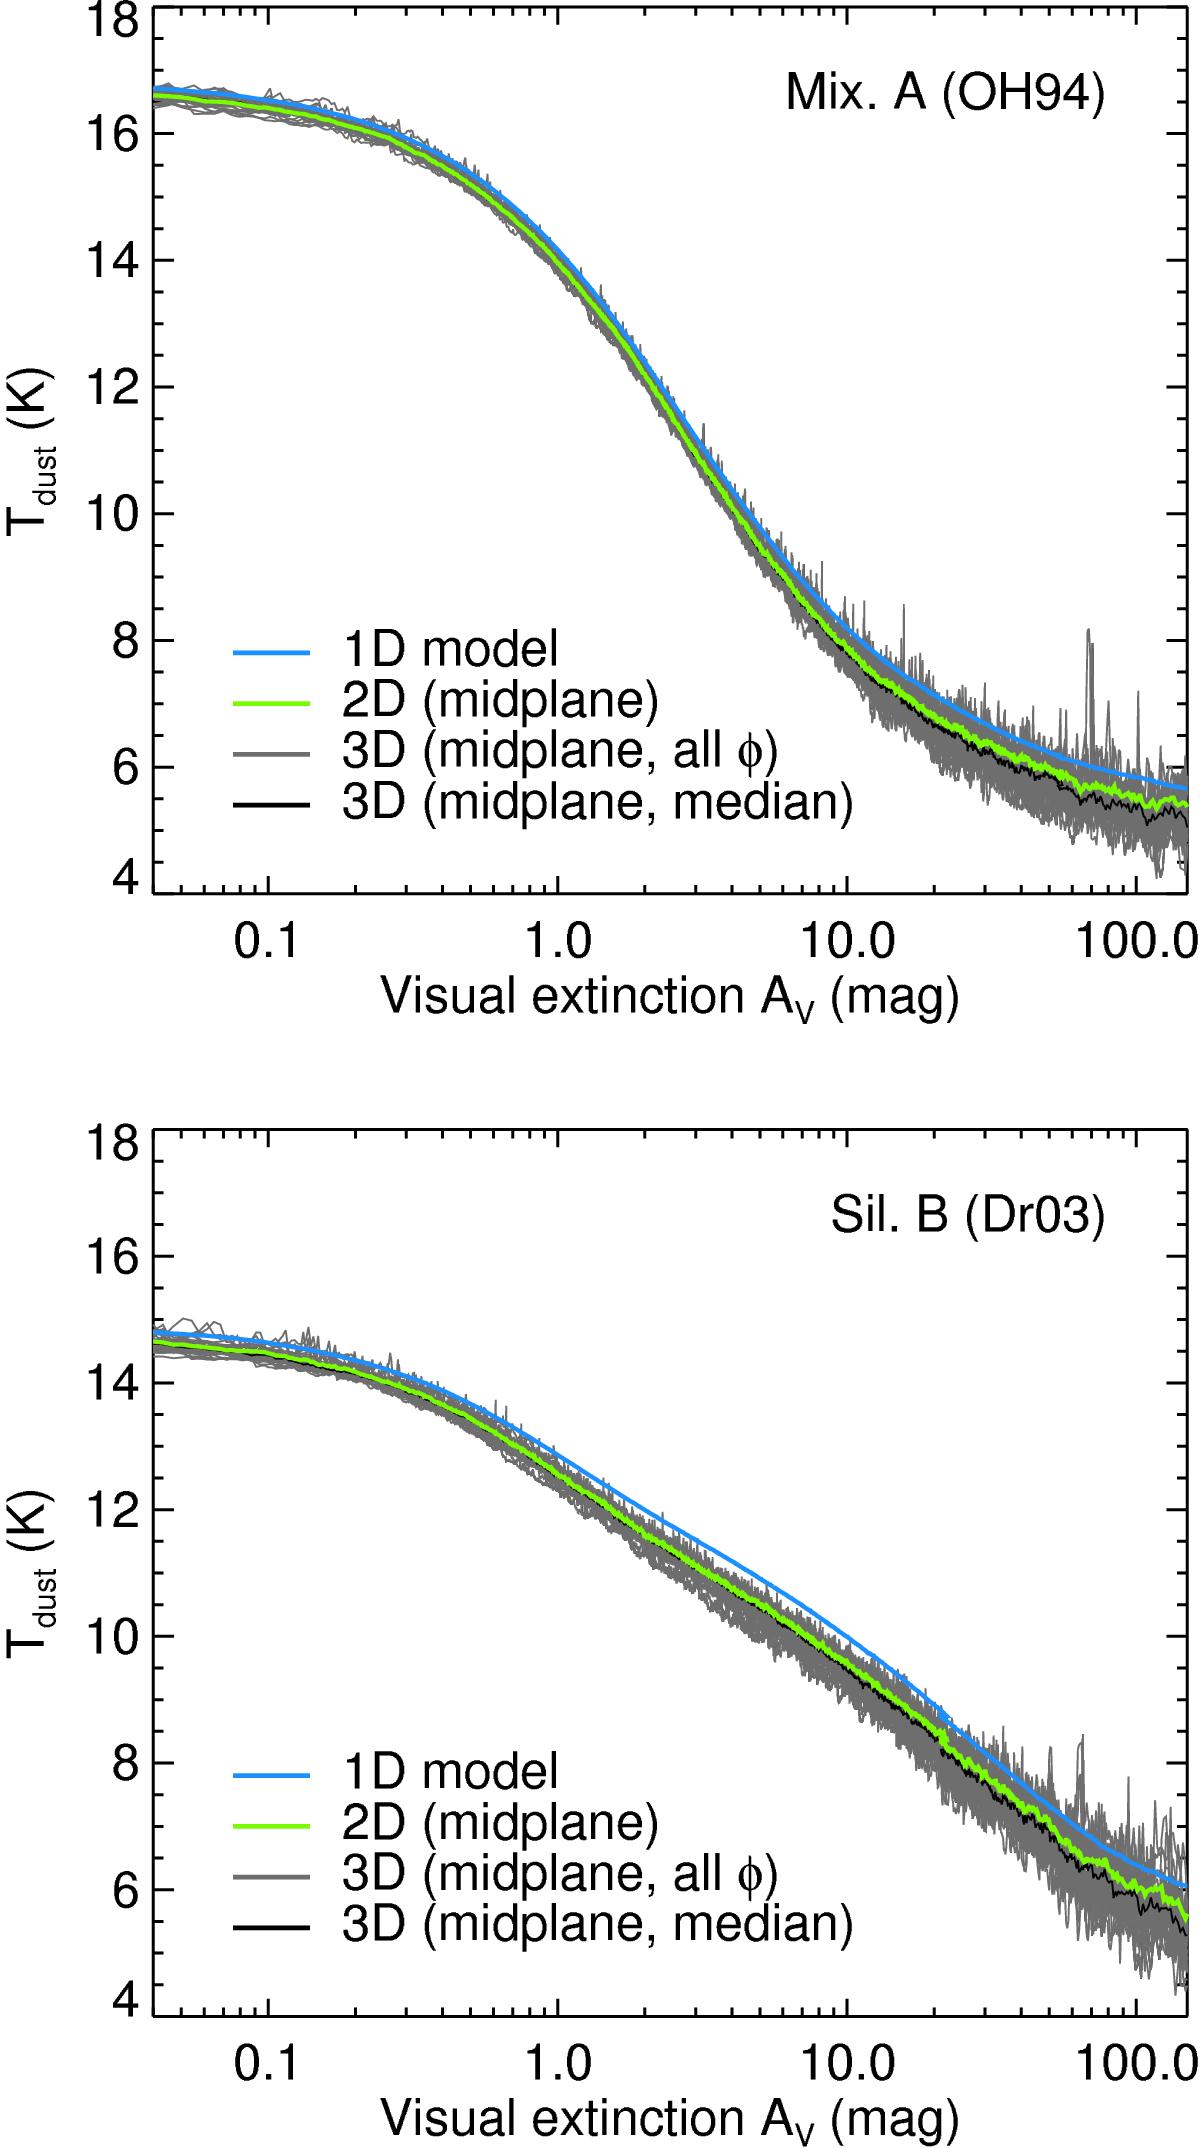
Dust temperature in different geometries. The top panel shows the dimension impact for the Mixed A dust material type. The bottom panel shows this for the Silicate B dust material. Blue line shows the 1D model results, green line the 2D results, and black line the 3D results. The greyscales illustrate the variation from all the φ angles in the 3D model.
Current usage metrics show cumulative count of Article Views (full-text article views including HTML views, PDF and ePub downloads, according to the available data) and Abstracts Views on Vision4Press platform.
Data correspond to usage on the plateform after 2015. The current usage metrics is available 48-96 hours after online publication and is updated daily on week days.
Initial download of the metrics may take a while.