Free Access
Fig. C.1
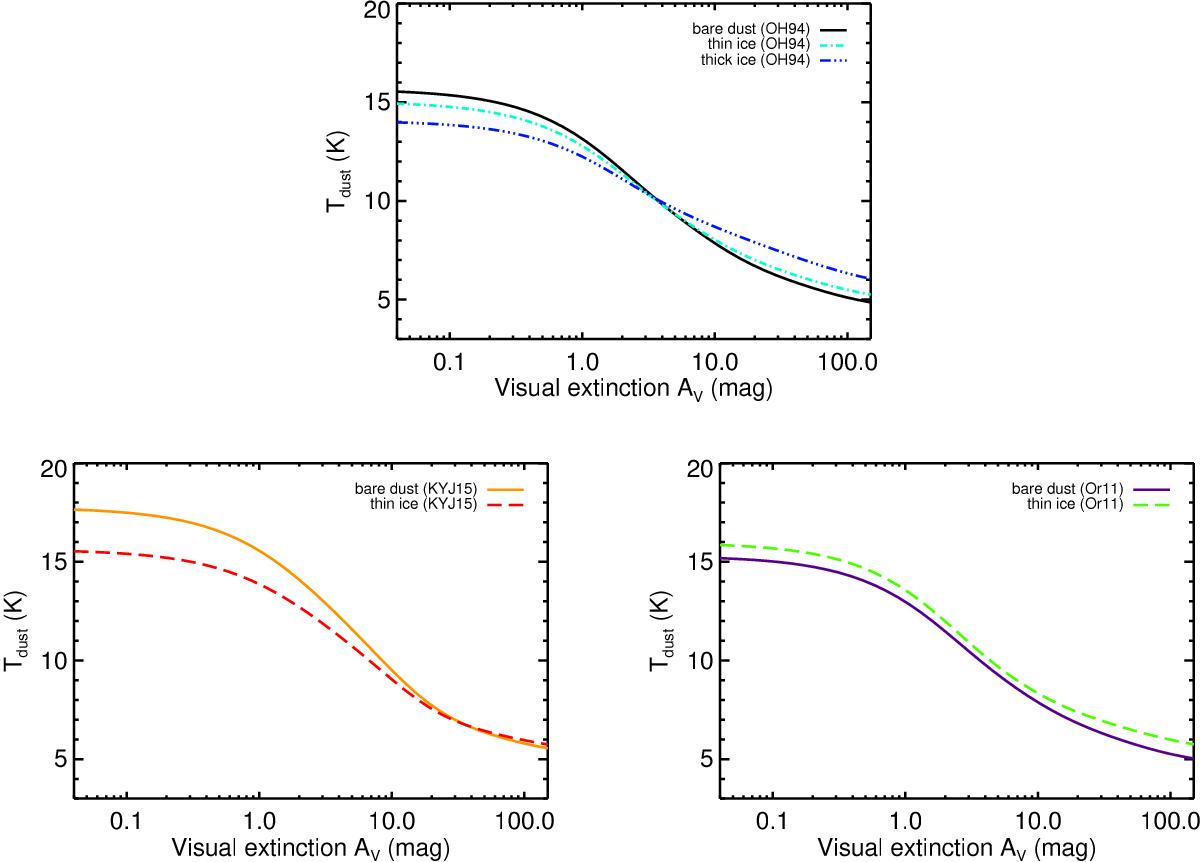
Td as a function of AV with ices. Similar to the right panel of Fig. 3, the impact of ices on the dust temperature is displayed. Top panel shows the OH94 models, but coagulated for 105 yr, while the bottom panels show the KYJ15 (left) and the Or11 (right) models.
This figure is made of several images, please see below:
Current usage metrics show cumulative count of Article Views (full-text article views including HTML views, PDF and ePub downloads, according to the available data) and Abstracts Views on Vision4Press platform.
Data correspond to usage on the plateform after 2015. The current usage metrics is available 48-96 hours after online publication and is updated daily on week days.
Initial download of the metrics may take a while.