Free Access
Fig. A.27
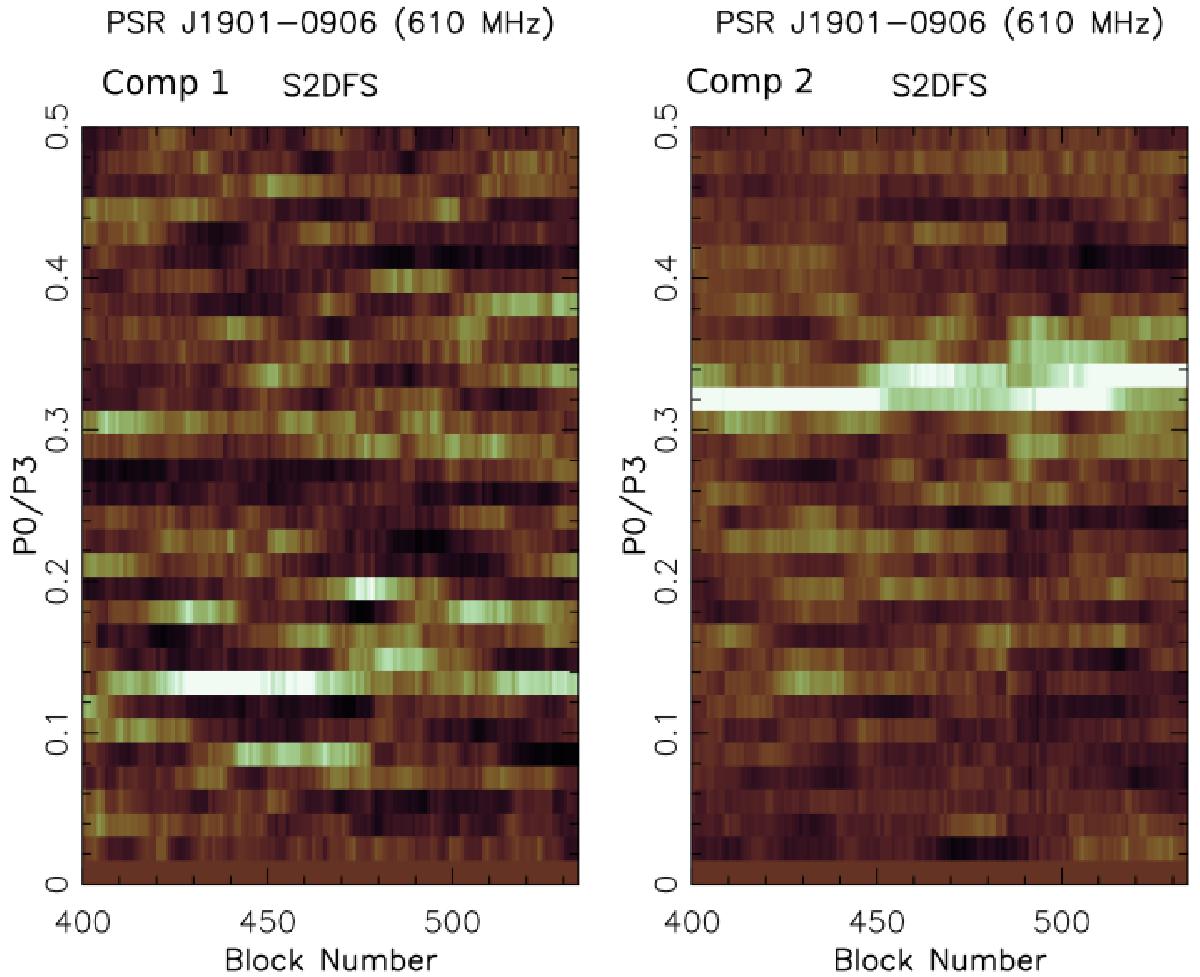
S2DFS for the two components of PSR J1901−0906 observed at 610 MHz. The plot on left is the S2DFS for the leading component and the plot on the right is for the trailing component.
Current usage metrics show cumulative count of Article Views (full-text article views including HTML views, PDF and ePub downloads, according to the available data) and Abstracts Views on Vision4Press platform.
Data correspond to usage on the plateform after 2015. The current usage metrics is available 48-96 hours after online publication and is updated daily on week days.
Initial download of the metrics may take a while.