Fig. 2
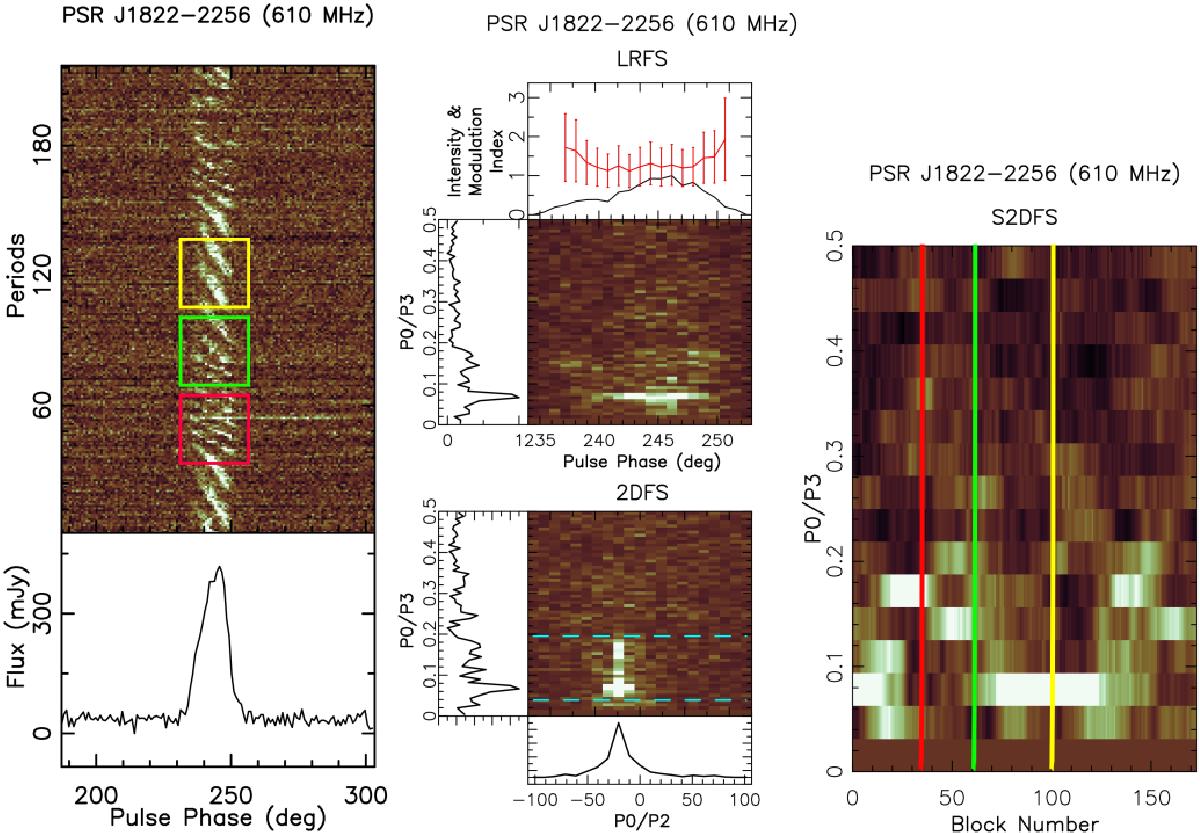
Example showing the results of the analyses using the LRFS, 2DFS, and S2DFS techniques for PSR J1822−2206. Left: single pulse sequence of PSR J1822−2206 showing the drift bands with different drift rates and a null. Middle: LRFS and 2DFS plots of the single pulse sequence shown at left. The top plot is LRFS with the ordinate as P0/P3 and abscissa is the pulse phase. The top panel of LRFS is the integrated pulse profile along with the longitude-resolved modulation index (red line with the error bars). The bottom plot has the same ordinate as the top plot, but its abscissa is in units of P0/P2. The bottom panel in 2DFS shows the fluctuation frequency across a pulse integrated vertically between the indicated dashed lines around a feature. The left panels in the both LRFS and 2DFS plots are the spectra, integrated horizontally across the corresponding colour plot. Right: P3 S2DFS map made from the observation at 610 MHz using the GMRT. The vertical axis is given in P0/P3. The horizontal axis is given in blocks, where a block corresponds to average over N (typically 256) pulses. Periodic subpulse modulation is indicated by the “tracks” in this plot. The red, green, and yellow zones indicate the blocks corresponding to zones indicated with similar colour in the single pulse sequence shown in the leftmost plot.
Current usage metrics show cumulative count of Article Views (full-text article views including HTML views, PDF and ePub downloads, according to the available data) and Abstracts Views on Vision4Press platform.
Data correspond to usage on the plateform after 2015. The current usage metrics is available 48-96 hours after online publication and is updated daily on week days.
Initial download of the metrics may take a while.