Fig. 1
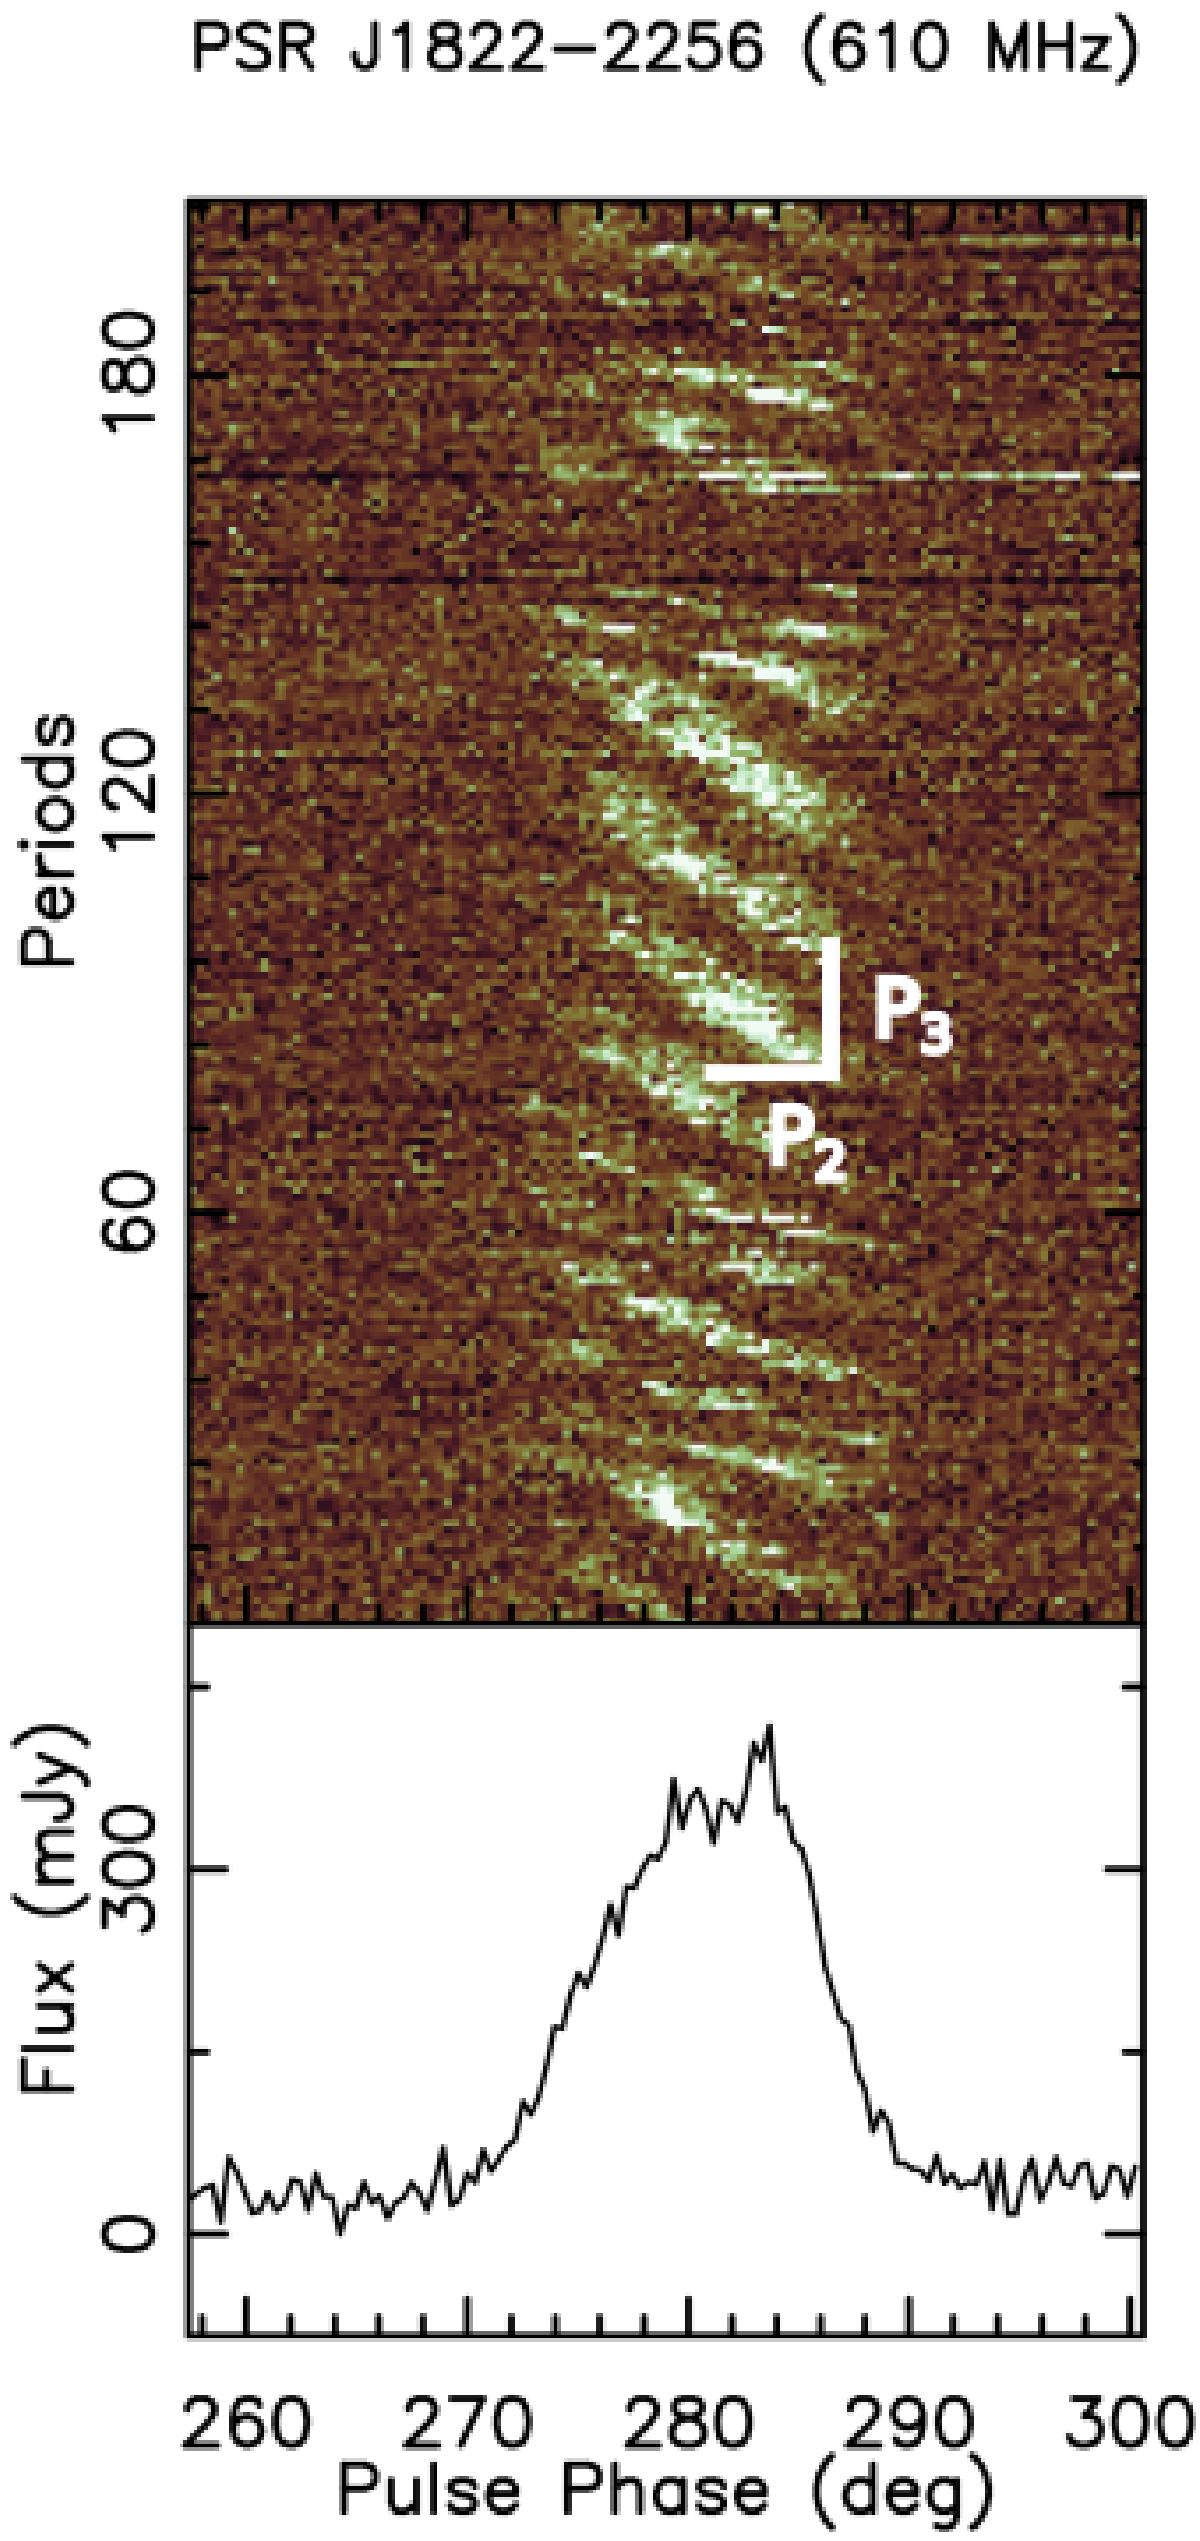
Example sequence of about 200 successive pulses of PSR J1822−2256 observed using the GMRT at 610 MHz. The subpulses appear earlier with increasing pulse number and are arranged into so-called “drift bands”. There are two distinct drift modes visible: a fast mode seen in the first 60 pulses followed by a slow mode. The two successive drift bands are vertically separated by P3 periods and horizontally separated by P2 degrees in phase as indicated for the slow mode. The slow drift mode is followed by a null between pulse number 144 and 176.
Current usage metrics show cumulative count of Article Views (full-text article views including HTML views, PDF and ePub downloads, according to the available data) and Abstracts Views on Vision4Press platform.
Data correspond to usage on the plateform after 2015. The current usage metrics is available 48-96 hours after online publication and is updated daily on week days.
Initial download of the metrics may take a while.