Open Access
Fig. 2
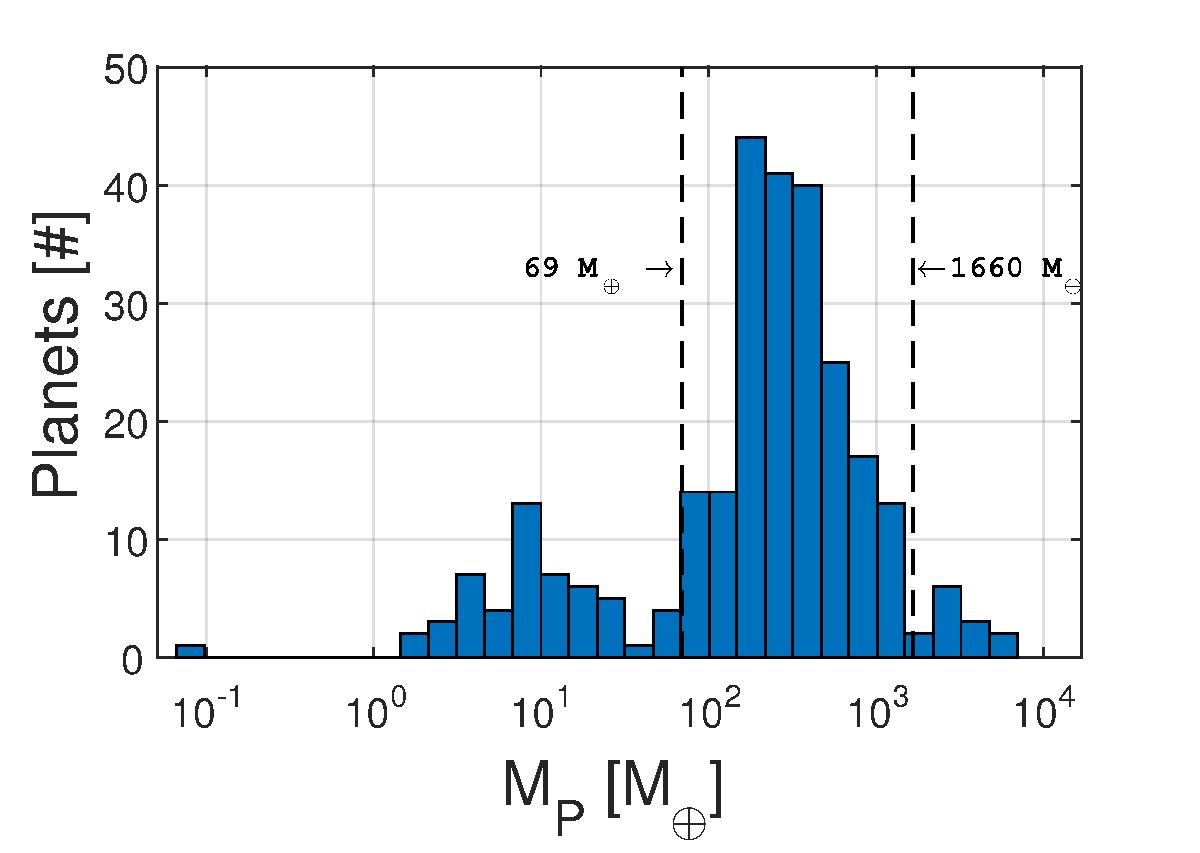
Histogram of planetary mass, showing clearly the three empirical mass ranges. The division into three intervals was performed in order to improve the quality of the statistical analysis (see text for details).
Current usage metrics show cumulative count of Article Views (full-text article views including HTML views, PDF and ePub downloads, according to the available data) and Abstracts Views on Vision4Press platform.
Data correspond to usage on the plateform after 2015. The current usage metrics is available 48-96 hours after online publication and is updated daily on week days.
Initial download of the metrics may take a while.