Fig. 25
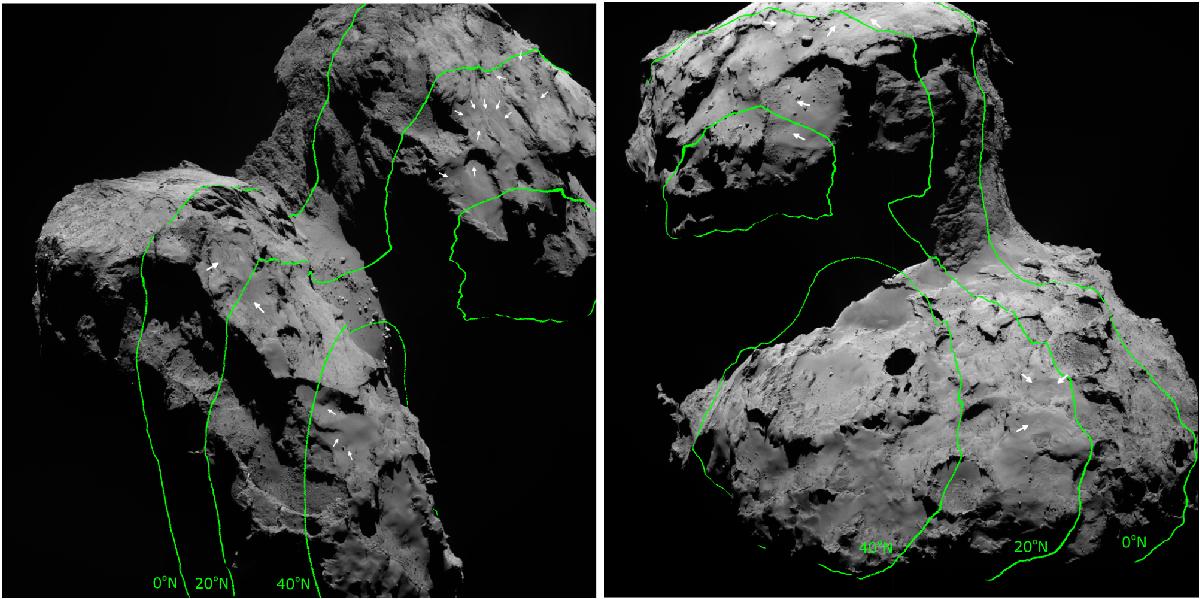
Distribution of honeycombs on 67P indicated on two context images with complementary views of the nucleus. Honeycombs are marked by white arrows. Three lines of latitudes, the equator, 20◦ N, and 40◦ N, are denoted by green lines. The latitudinal line at 40◦ N is disconnected and circumscribing each lobe, which arises from the ambiguity of the latitude-longitude system (Preusker et al. 2015).
Current usage metrics show cumulative count of Article Views (full-text article views including HTML views, PDF and ePub downloads, according to the available data) and Abstracts Views on Vision4Press platform.
Data correspond to usage on the plateform after 2015. The current usage metrics is available 48-96 hours after online publication and is updated daily on week days.
Initial download of the metrics may take a while.