Free Access
Fig. 9
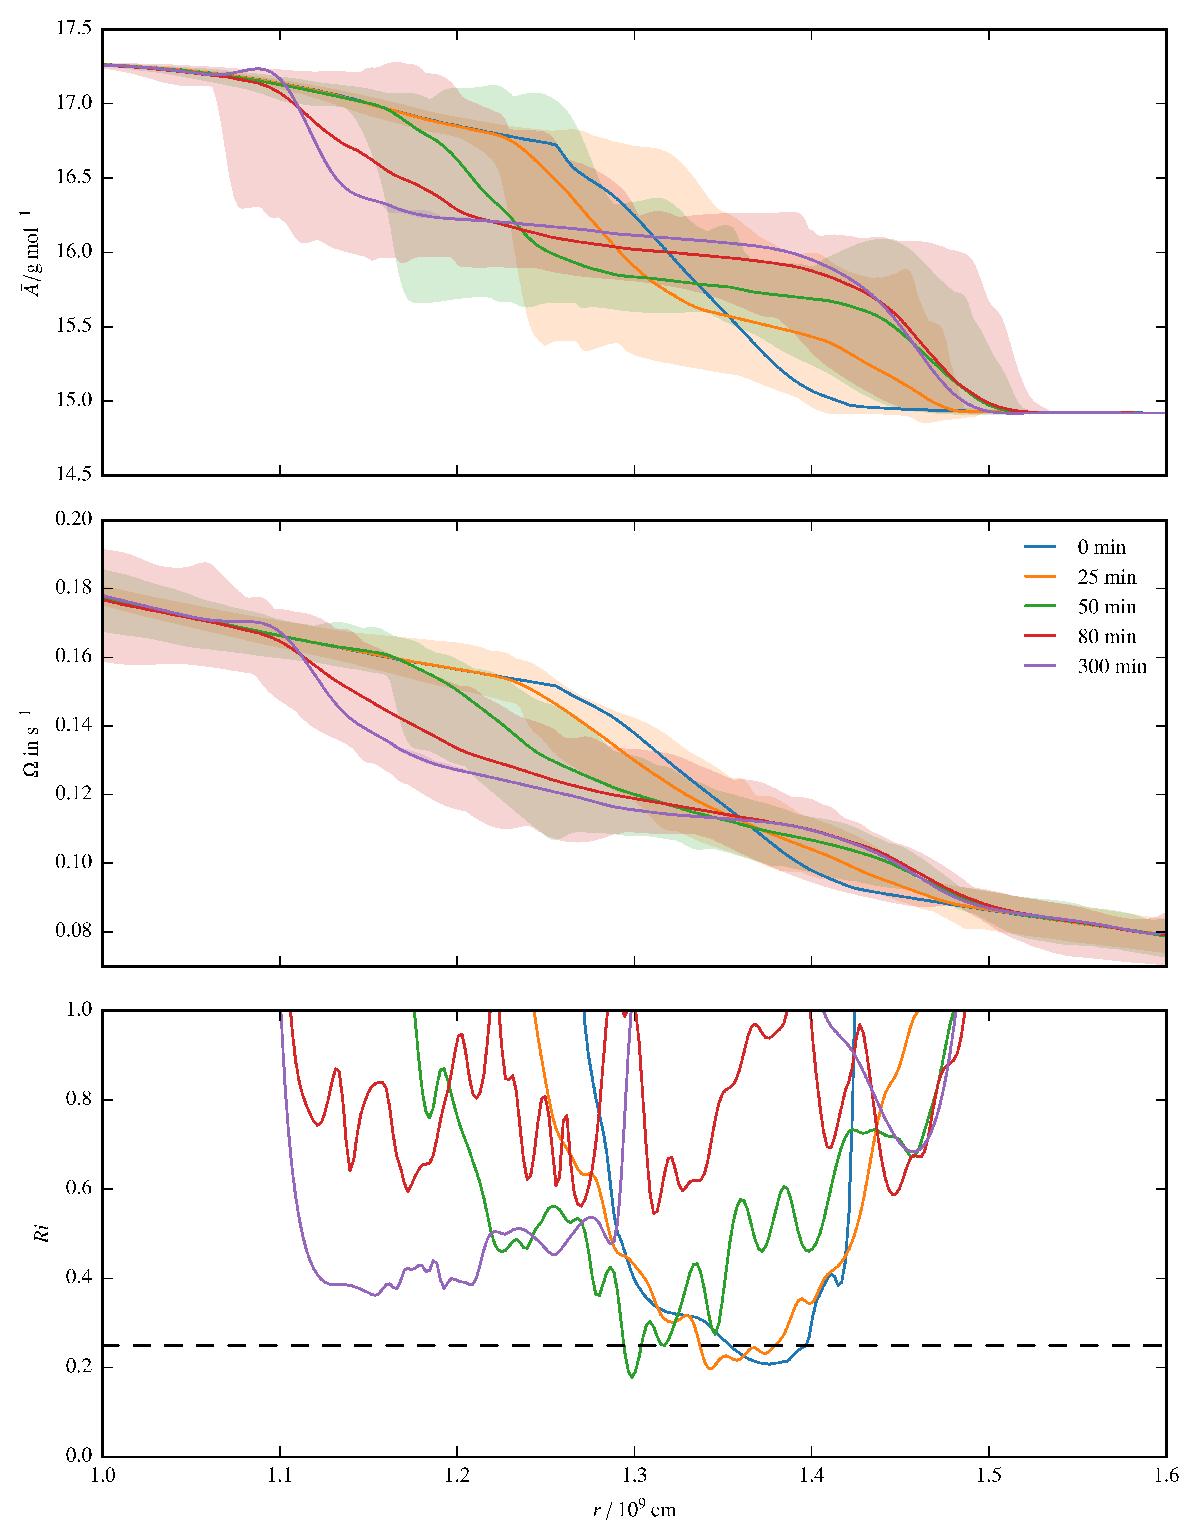
Angular average of mean atomic mass ![]() , angular velocity Ω, and Richardson number Ri for snapshots at different times indicated by line color. The regions shaded in the respective line color show the range between the minimum and maximum value at the respective radius.
, angular velocity Ω, and Richardson number Ri for snapshots at different times indicated by line color. The regions shaded in the respective line color show the range between the minimum and maximum value at the respective radius.
Current usage metrics show cumulative count of Article Views (full-text article views including HTML views, PDF and ePub downloads, according to the available data) and Abstracts Views on Vision4Press platform.
Data correspond to usage on the plateform after 2015. The current usage metrics is available 48-96 hours after online publication and is updated daily on week days.
Initial download of the metrics may take a while.