Fig. 5
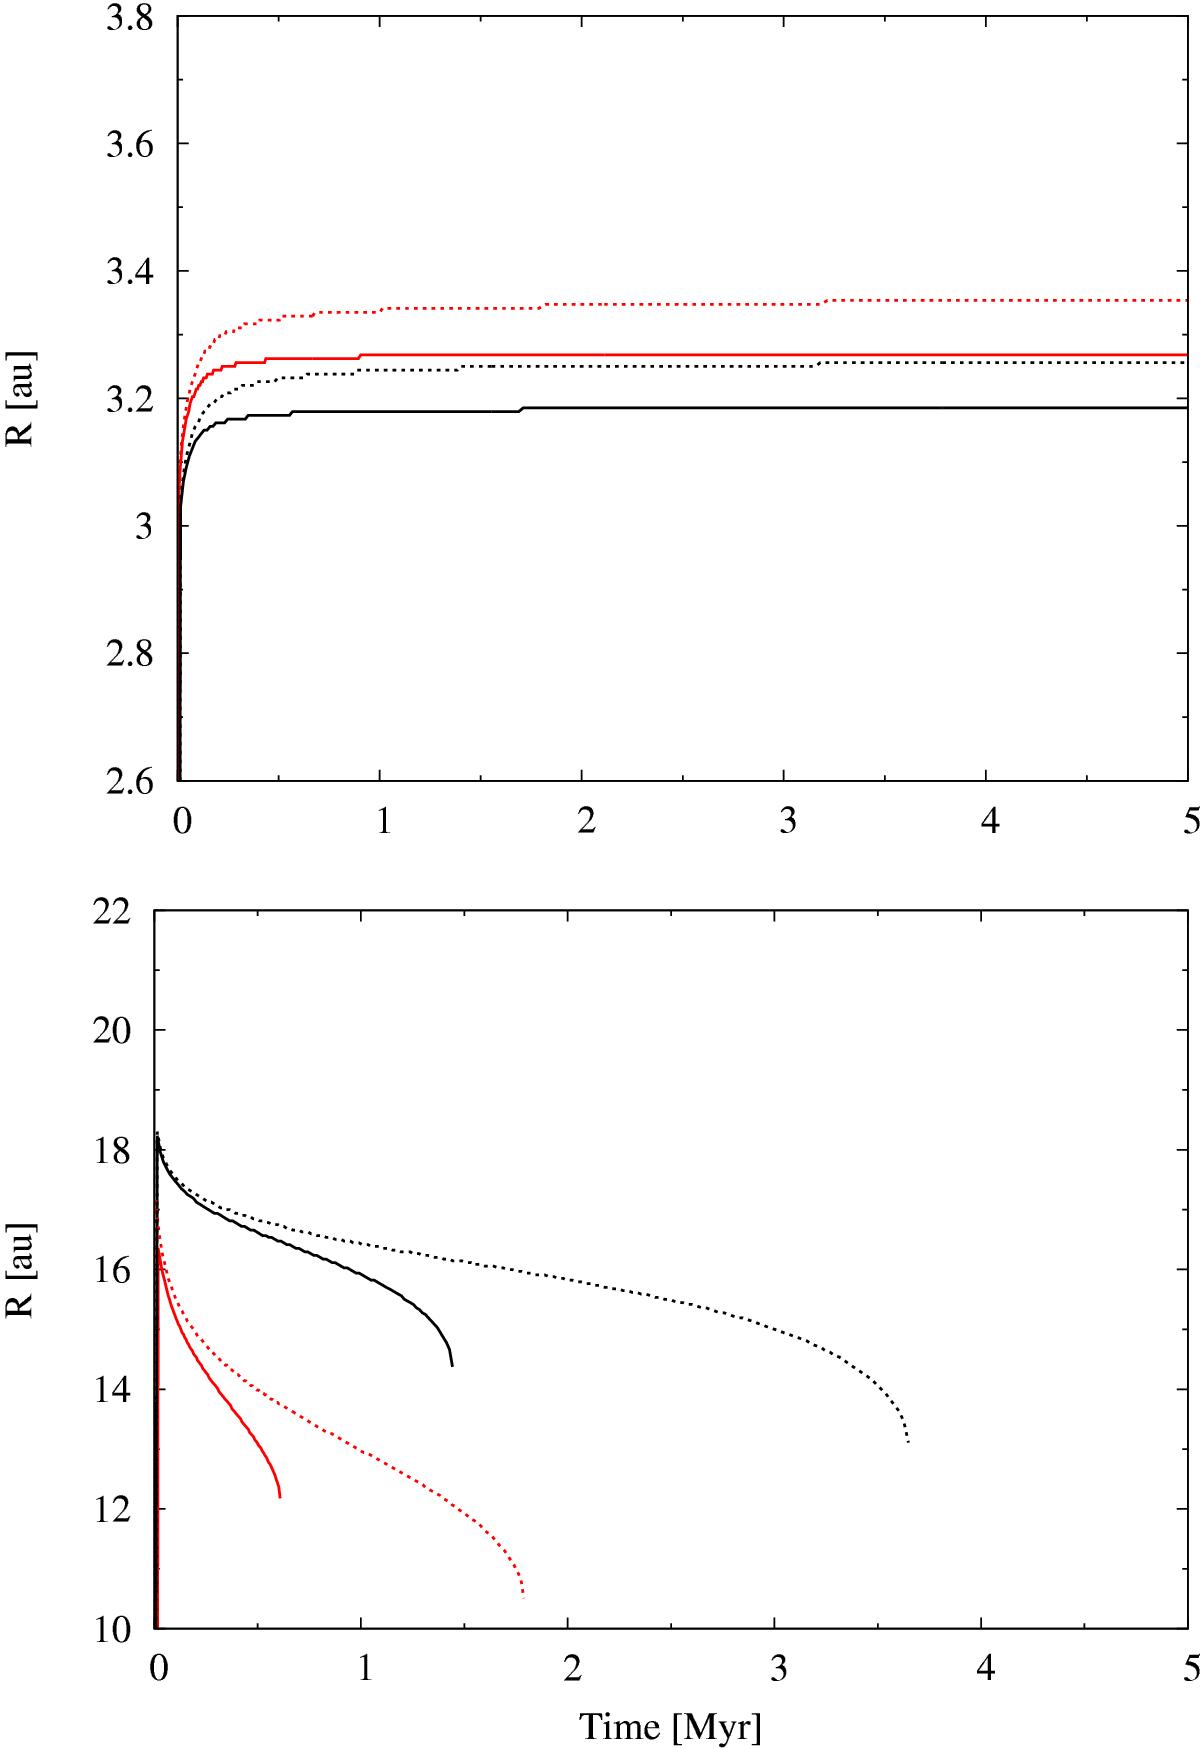
Time evolution of the zero torque locations (solid lines) and the locations of pressure maxima (dashed lines) at the inner egde (top panel) and outer edge (bottom panel) of the dead zone for a flared disk (red lines) and a flat disk (black lines). Simulations correspond to a disk of Md = 0.1 M⊙ using Rin - dz = 2.7 au, Rout - dz = 20 au, αback = 10-3, and αdz = 10-5.
Current usage metrics show cumulative count of Article Views (full-text article views including HTML views, PDF and ePub downloads, according to the available data) and Abstracts Views on Vision4Press platform.
Data correspond to usage on the plateform after 2015. The current usage metrics is available 48-96 hours after online publication and is updated daily on week days.
Initial download of the metrics may take a while.