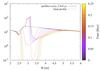
Fig. 12
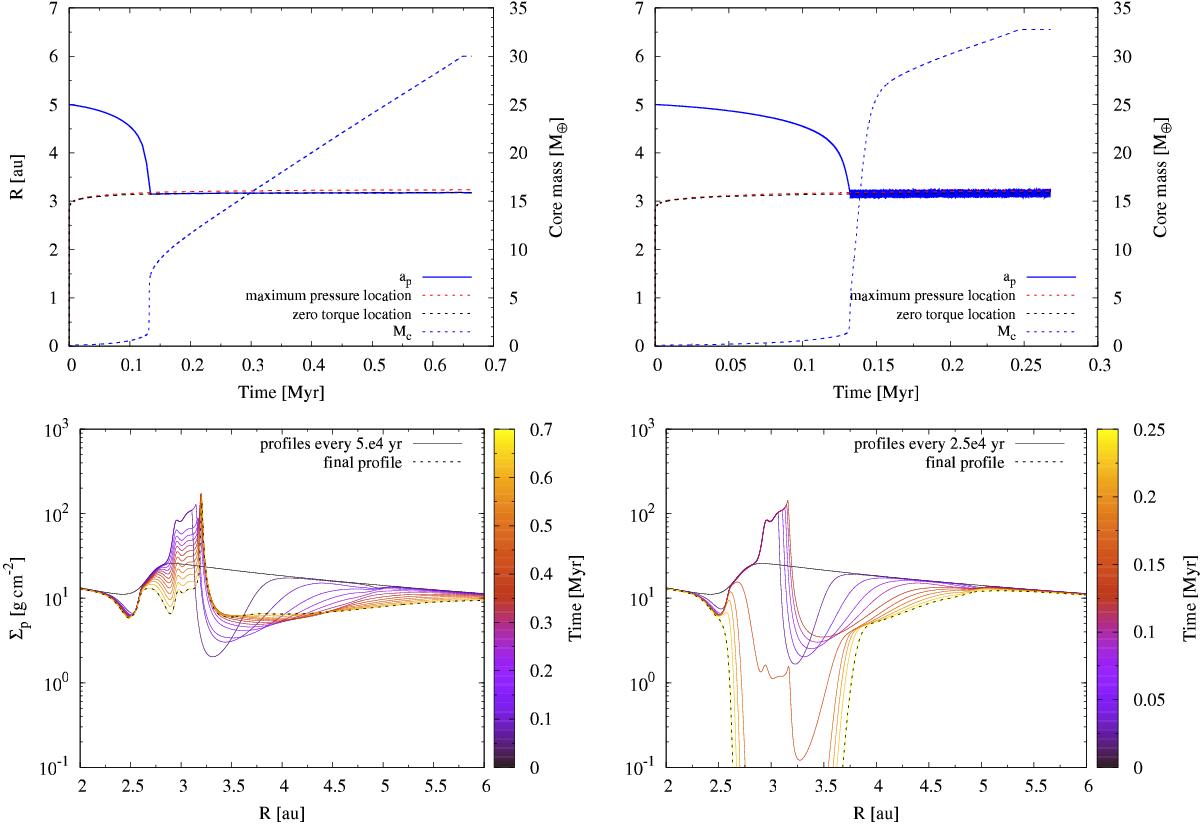
Top: time evolution of the planet’s semi-major axis (left y-axis) and planet’s core mass (right y-axis) being initially located at 5 au. The red dashed line represents the location of the pressure maximum, and the black dashed line represents the zero torque position. Bottom: time evolution (color palette) of the planetesimal surface density radial profiles. The left panel represents the case where the planet is trapped at the zero torque location, while the right panel represents the case where the semi-major axis of the planet oscillates around the zero torque location after being trapped. Simulations correspond to a flat disk with mass Md = 0.1 M⊙ using αback = 10-3, αdz = 10-5, Rin - dz = 2.7 au, Rout - dz = 20 au, and planetesimals of 1 km radius. Simulations end when the planet achieves critical mass.
Current usage metrics show cumulative count of Article Views (full-text article views including HTML views, PDF and ePub downloads, according to the available data) and Abstracts Views on Vision4Press platform.
Data correspond to usage on the plateform after 2015. The current usage metrics is available 48-96 hours after online publication and is updated daily on week days.
Initial download of the metrics may take a while.