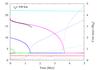
Fig. 11
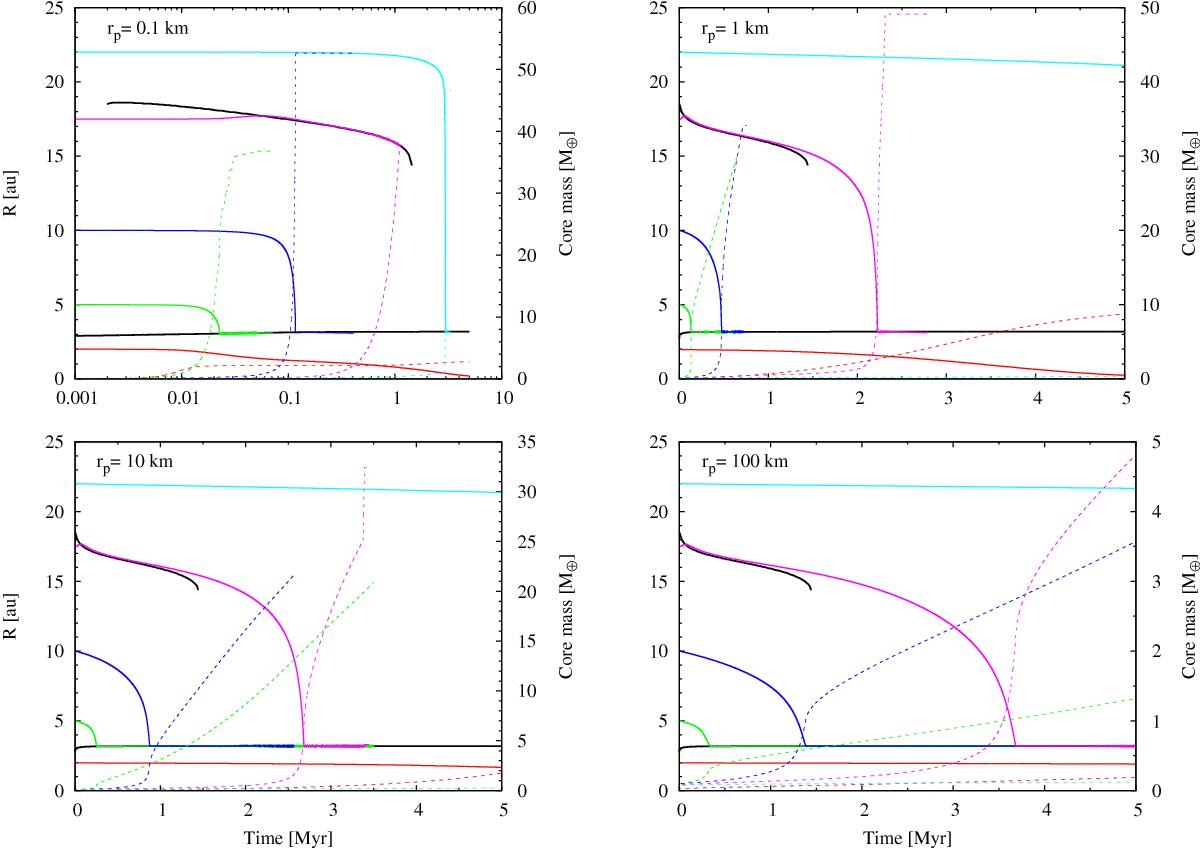
Time evolution of the planet’s semi-major axis (left y-axis) and planet’s core mass (right y-axis) for different initial planet locations: 2 au, 5 au, 10 au, 17.5 au, and 22 au. Black lines represent the position of the zero torque. Simulations correspond to a flat disk with a mass of Md = 0.1 M⊙ using αback = 10-3, αdz = 10-5, Rin - dz = 2.7 au and Rout - dz = 20 au. Simulations end when the planet achieves critical mass or after 5 Myr of viscous disk evolution.
Current usage metrics show cumulative count of Article Views (full-text article views including HTML views, PDF and ePub downloads, according to the available data) and Abstracts Views on Vision4Press platform.
Data correspond to usage on the plateform after 2015. The current usage metrics is available 48-96 hours after online publication and is updated daily on week days.
Initial download of the metrics may take a while.