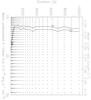
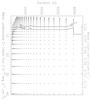
Fig. 2

Flare detection efficiency of the Bayesian blocks algorithm (top panel) and the Degenaar et al. (2013) detection method (bottom panel) in the Swift observations. The points are the simulation grid for the Gaussian flare light curve above a non-flaring level of 0.027 counts s-1 in the 2–10 keV energy range. The contour levels are the detection probabilities in percent.
Current usage metrics show cumulative count of Article Views (full-text article views including HTML views, PDF and ePub downloads, according to the available data) and Abstracts Views on Vision4Press platform.
Data correspond to usage on the plateform after 2015. The current usage metrics is available 48-96 hours after online publication and is updated daily on week days.
Initial download of the metrics may take a while.