Fig. 8
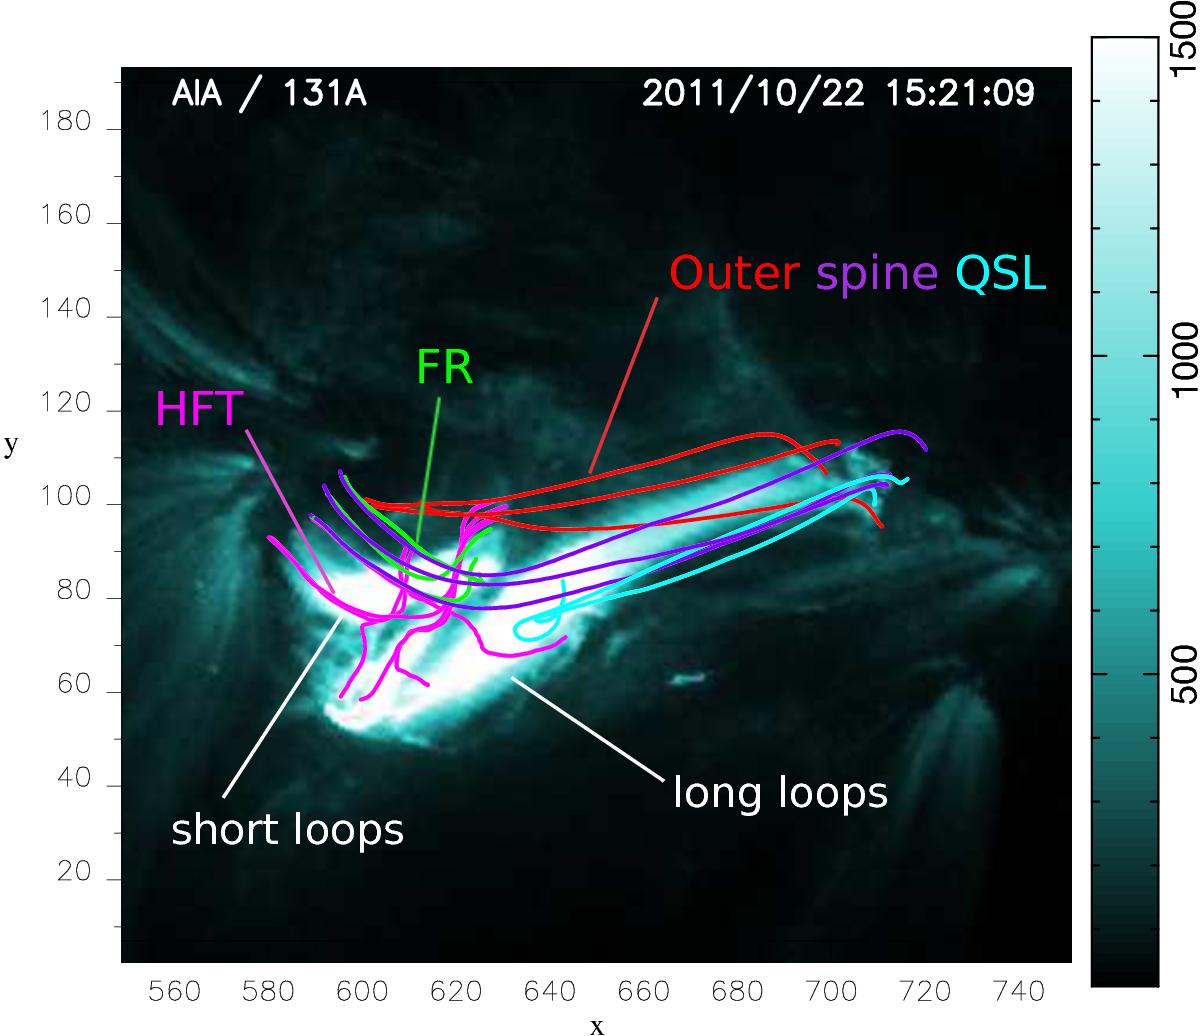
Association between the EUV post-flare loops and the topological elements: 131 Å image at the time of the main phase of the flare (15:21 UT) on which is overplotted green field lines corresponding to the flux rope structure, pink lines showing the HFT related QSL field lines, red and purple lines representing the outer spine QSL-halo, light blue field lines showing the field connecting the outer spine and R3. The CEA projection is used for the co-alignment and the x- and y-axis units are in arcseconds defined by the CEA projection.
Current usage metrics show cumulative count of Article Views (full-text article views including HTML views, PDF and ePub downloads, according to the available data) and Abstracts Views on Vision4Press platform.
Data correspond to usage on the plateform after 2015. The current usage metrics is available 48-96 hours after online publication and is updated daily on week days.
Initial download of the metrics may take a while.