Fig. 3
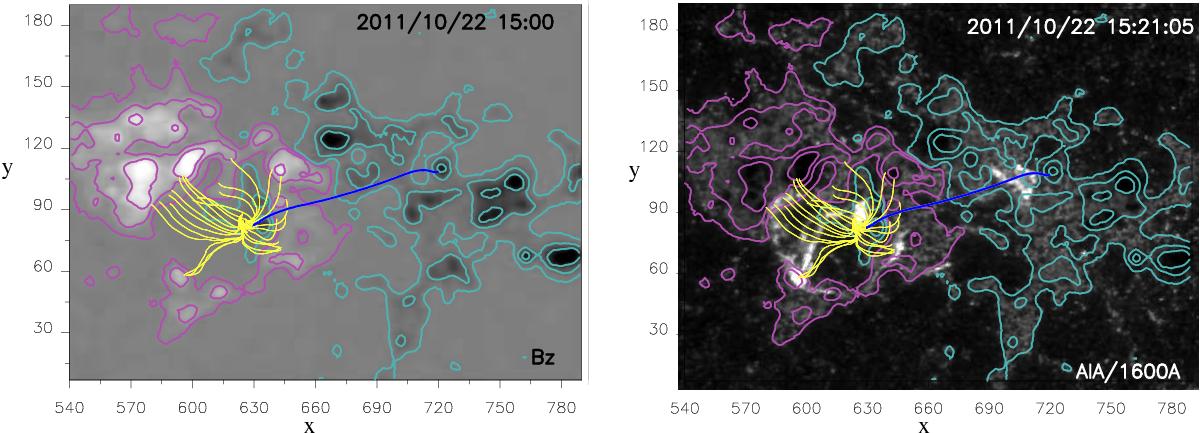
Null-point topology resulting from the NLFF extrapolation. Left panel: grey shading indicates the line-of-sight magnetic field. Pink and blue iso-contours correspond to positive and negative Blos = ± 40,250,750 G, respectively. Blue and yellow field lines indicate respectively the spine and the fan separatrices. Right panel: co-spatiality between the chromospheric solar ribbons observed at 1600 Å and the location of the separatrix footpoints. The x- and y-axis units are in arcseconds defined by the CEA projection.
Current usage metrics show cumulative count of Article Views (full-text article views including HTML views, PDF and ePub downloads, according to the available data) and Abstracts Views on Vision4Press platform.
Data correspond to usage on the plateform after 2015. The current usage metrics is available 48-96 hours after online publication and is updated daily on week days.
Initial download of the metrics may take a while.