Fig. 2
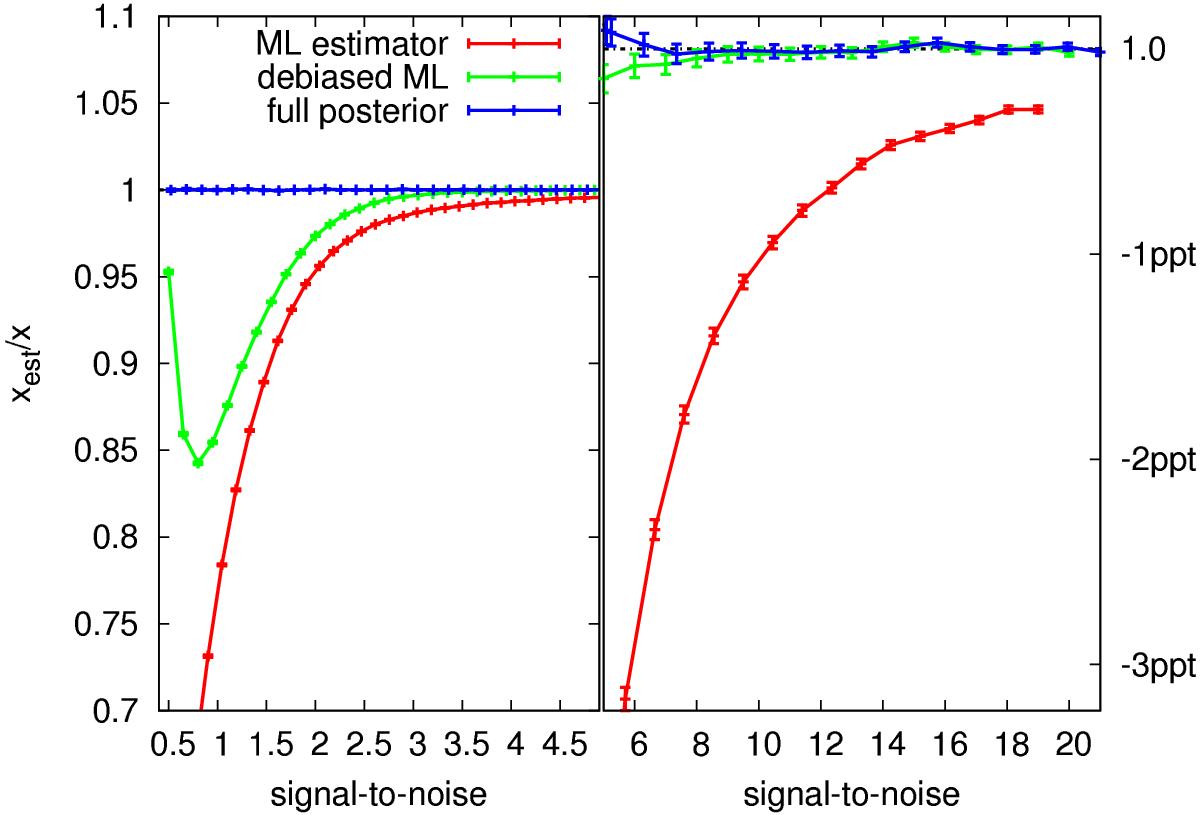
Toy-model demonstration of a maximum-likelihood estimator (red), a maximum-likelihood estimator with first-order bias correction (green), and an estimator exploiting the full posterior (blue). Data points display the estimator average (y-axis) over 106 data points at varying signal-to-noise levels (x-axis). The true value to be estimated is x = 1. The panels show different signal-to-noise regimes; − nppt denotes y = 1 − n/ 103.
Current usage metrics show cumulative count of Article Views (full-text article views including HTML views, PDF and ePub downloads, according to the available data) and Abstracts Views on Vision4Press platform.
Data correspond to usage on the plateform after 2015. The current usage metrics is available 48-96 hours after online publication and is updated daily on week days.
Initial download of the metrics may take a while.