Fig. 8
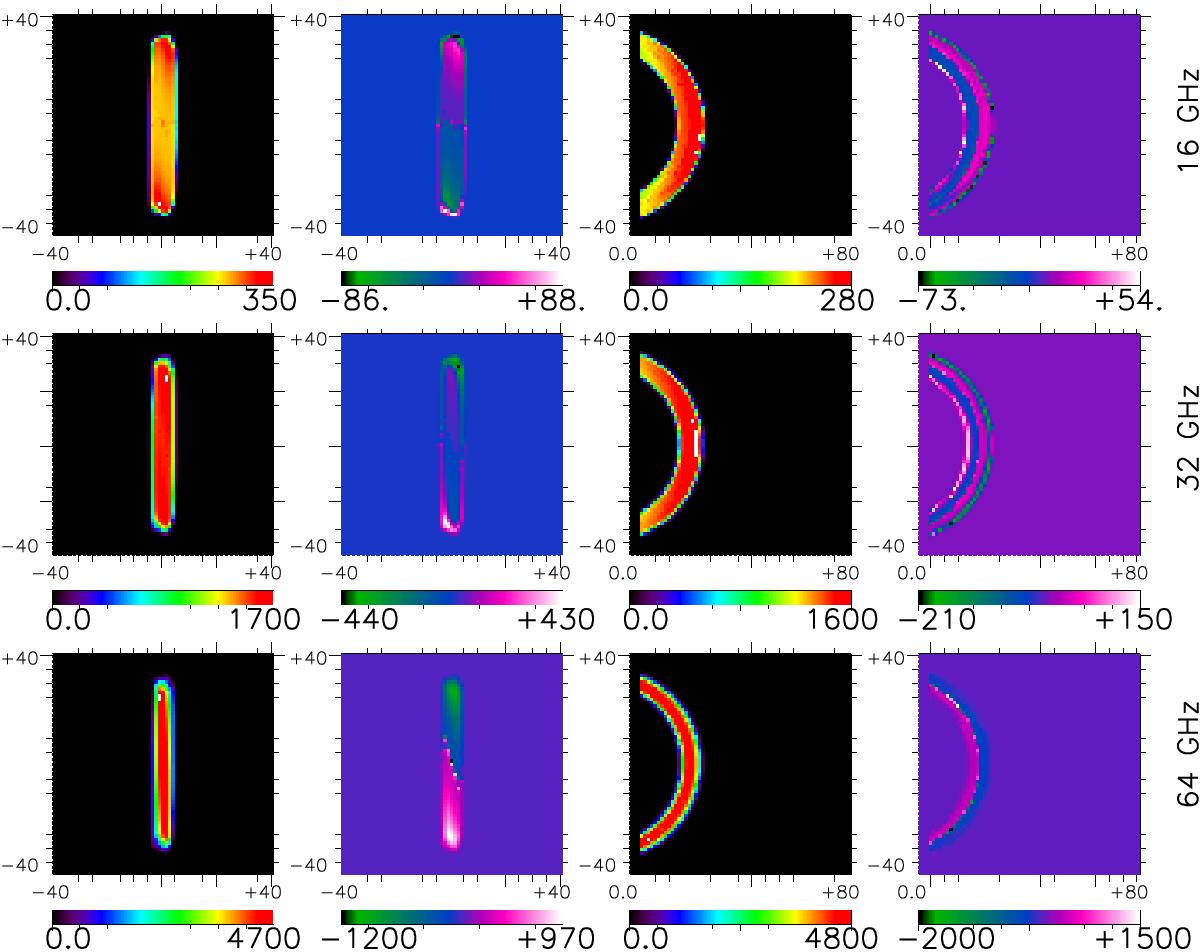
Microwave emission maps from the loop in model C soon after the kink instability and start of the magnetic energy release and particle acceleration (t = 2 s). First and second columns correspond to Stokes I and V intensities, respectively, when the loop is seen from the top (X-Y plain). Third and fourth columns are Stokes I and V intensities, respectively, for the loop seen from its side (Z-Y plain). Different rows correspond to different frequencies. Intensities are given in sfu units.
Current usage metrics show cumulative count of Article Views (full-text article views including HTML views, PDF and ePub downloads, according to the available data) and Abstracts Views on Vision4Press platform.
Data correspond to usage on the plateform after 2015. The current usage metrics is available 48-96 hours after online publication and is updated daily on week days.
Initial download of the metrics may take a while.