Fig. 3
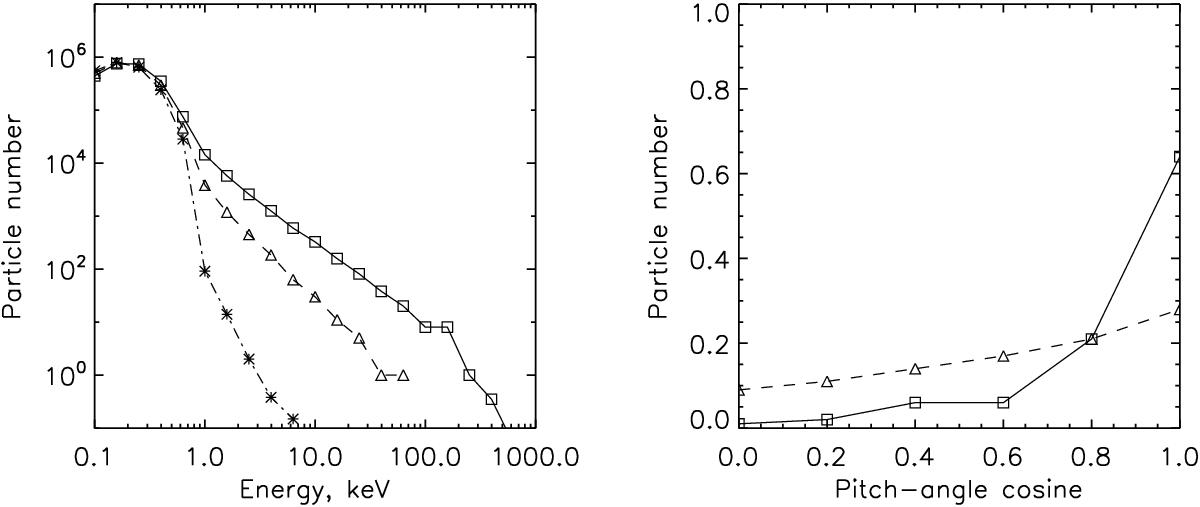
Energy distributions of particles (left panel) and pitch-angle cosine distribution of particles with energies above 10 keV (right panel) in Model B. Solid line with squares corresponds to t = 2 s (just after the onset of reconnection), dashed line with triangles corresponds to t = 30 s (the moment of highest plasma temperature), and dot-dashed line with stars corresponds to t = 58 s (towards the end of reconnection). There is no pitch-angle distribution for t = 58 s because there are not enough particles with energies above 10 keV. Particles numbers are in arbitrary units.
Current usage metrics show cumulative count of Article Views (full-text article views including HTML views, PDF and ePub downloads, according to the available data) and Abstracts Views on Vision4Press platform.
Data correspond to usage on the plateform after 2015. The current usage metrics is available 48-96 hours after online publication and is updated daily on week days.
Initial download of the metrics may take a while.