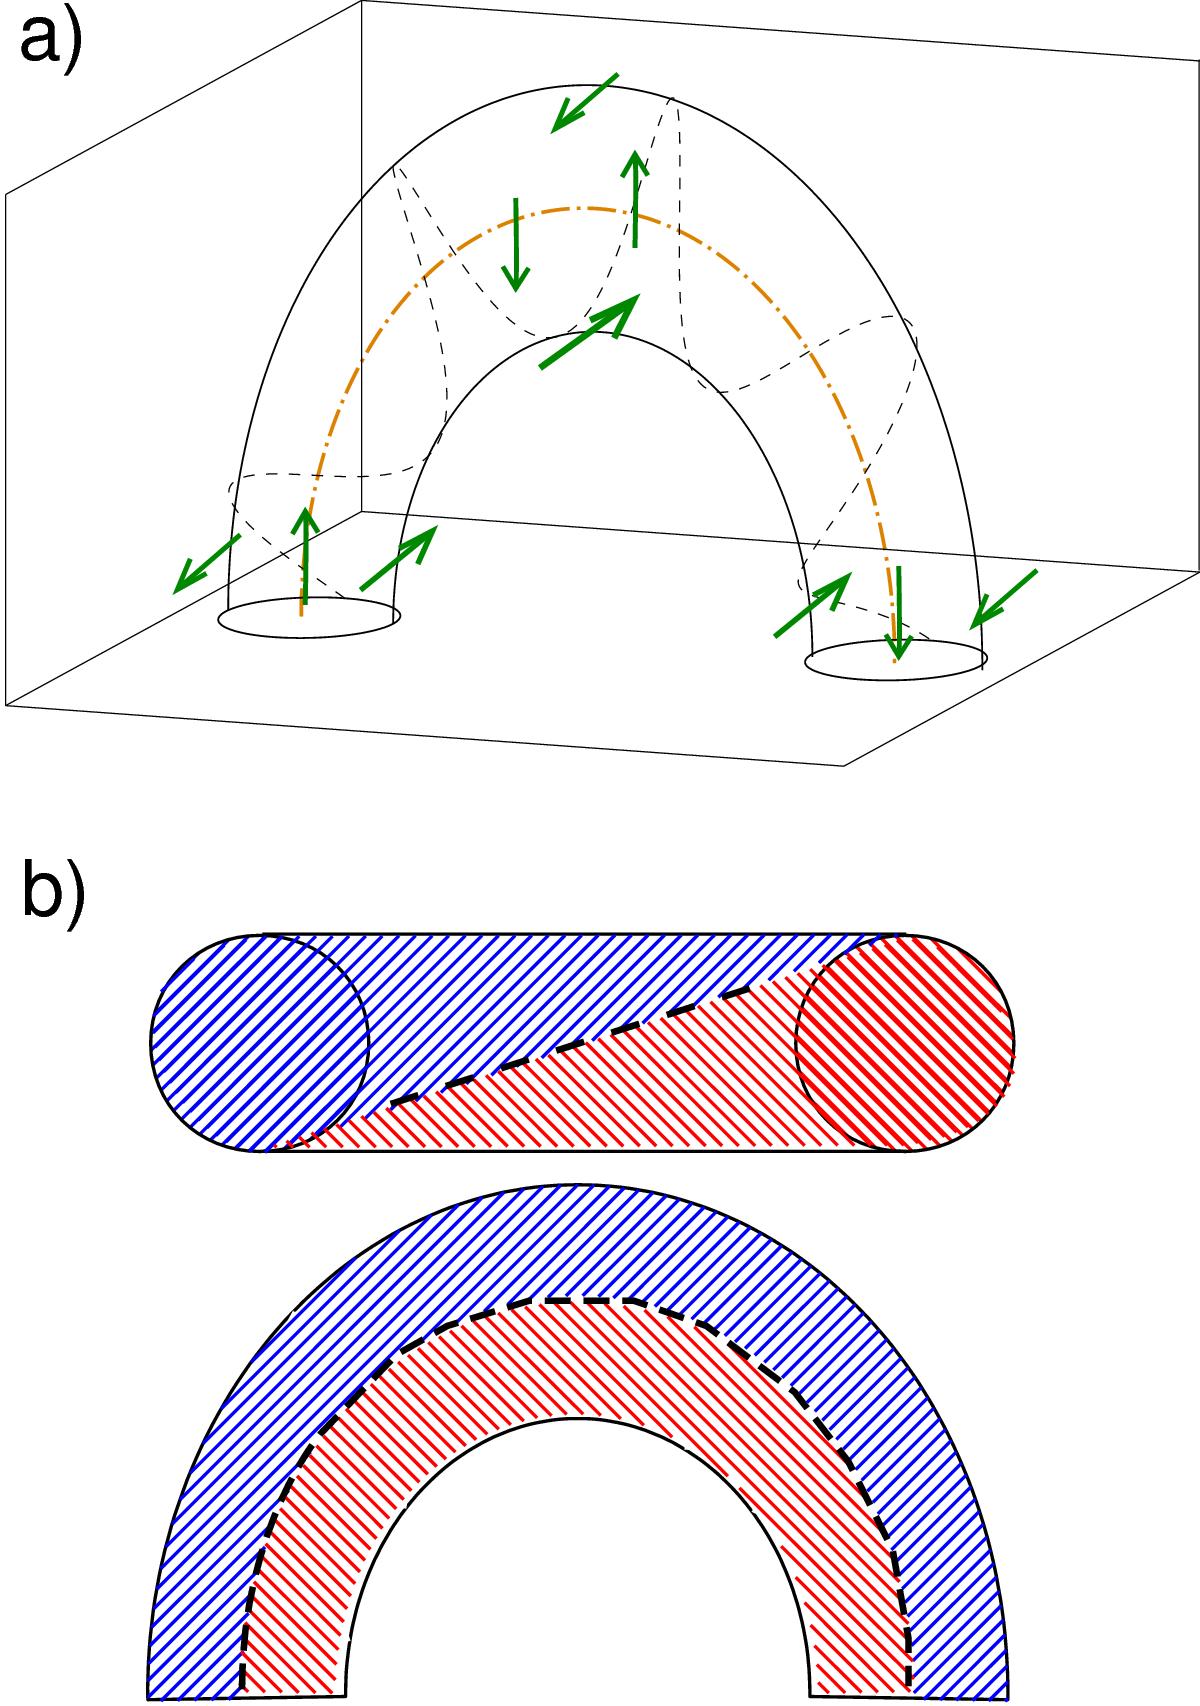
Fig. 1

Panel a: schematic drawing of a twisted loop. Green arrows show the longitudinal and azimuthal magnetic field in selected locations. Orange dot-dashed line denotes the “skeleton line”, i.e. the magnetic field line connecting centres of loop footpoints. Panel b: schematic drawings of the cross-loop polarisation gradient (CLPG) patterns in cases when a loop is observed from its top and from its side. Blue forward slash hatching and red backslash hatching correspond to positive and negative values of Stokes V, respectively. Black dashed lines denote Stokes V = 0.
Current usage metrics show cumulative count of Article Views (full-text article views including HTML views, PDF and ePub downloads, according to the available data) and Abstracts Views on Vision4Press platform.
Data correspond to usage on the plateform after 2015. The current usage metrics is available 48-96 hours after online publication and is updated daily on week days.
Initial download of the metrics may take a while.


