Fig. 9
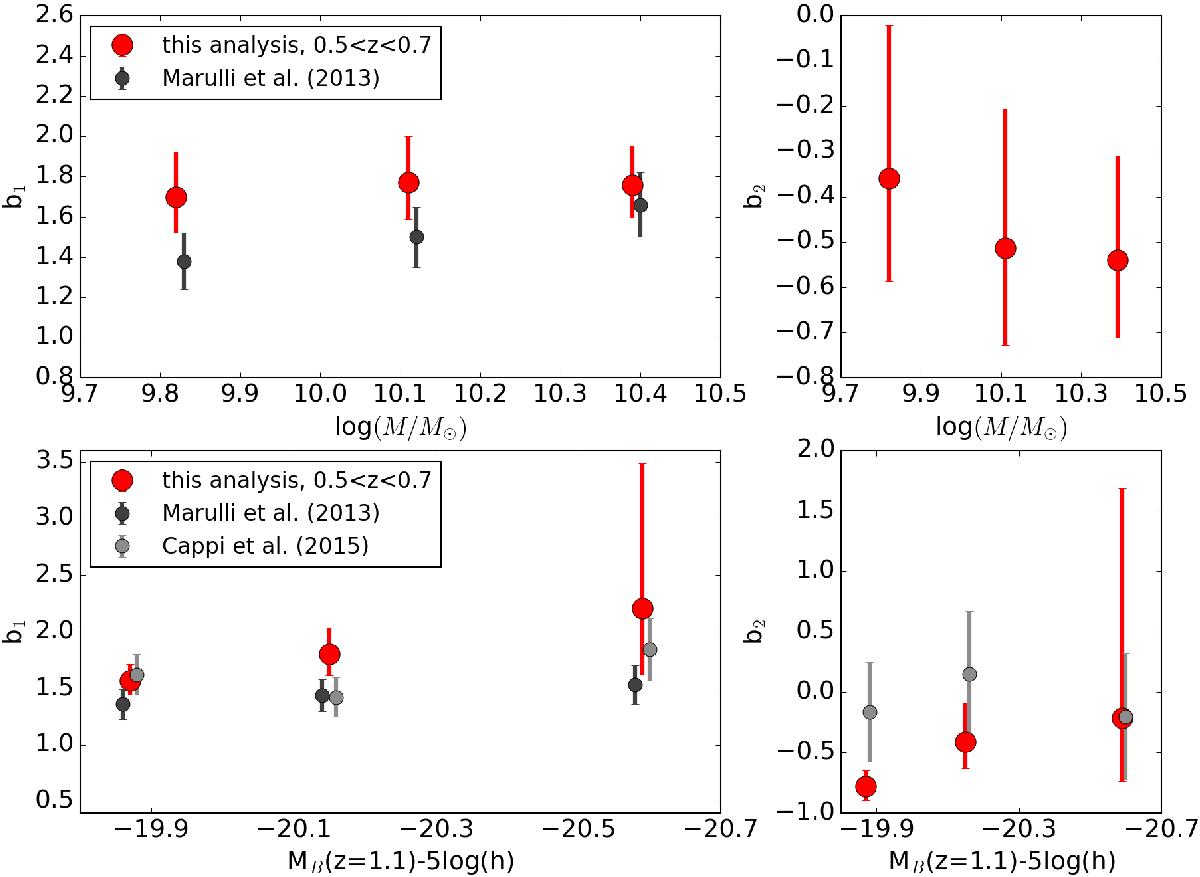
Galaxy linear bias (left panels, b1) and non linear bias (right panels, b2) as a function of stellar mass (upper panel) and luminosity (lower panel). Independent measurements obtained on the same subsamples are shown for comparison: from the 2PCF (black points Marulli et al. 2013) and from volume-averaged higher-order correlation functions (grey points Cappi et al. 2015). The values on the x-axis have been slightly offset, for illustrative purposes.
Current usage metrics show cumulative count of Article Views (full-text article views including HTML views, PDF and ePub downloads, according to the available data) and Abstracts Views on Vision4Press platform.
Data correspond to usage on the plateform after 2015. The current usage metrics is available 48-96 hours after online publication and is updated daily on week days.
Initial download of the metrics may take a while.