Free Access
Fig. 8
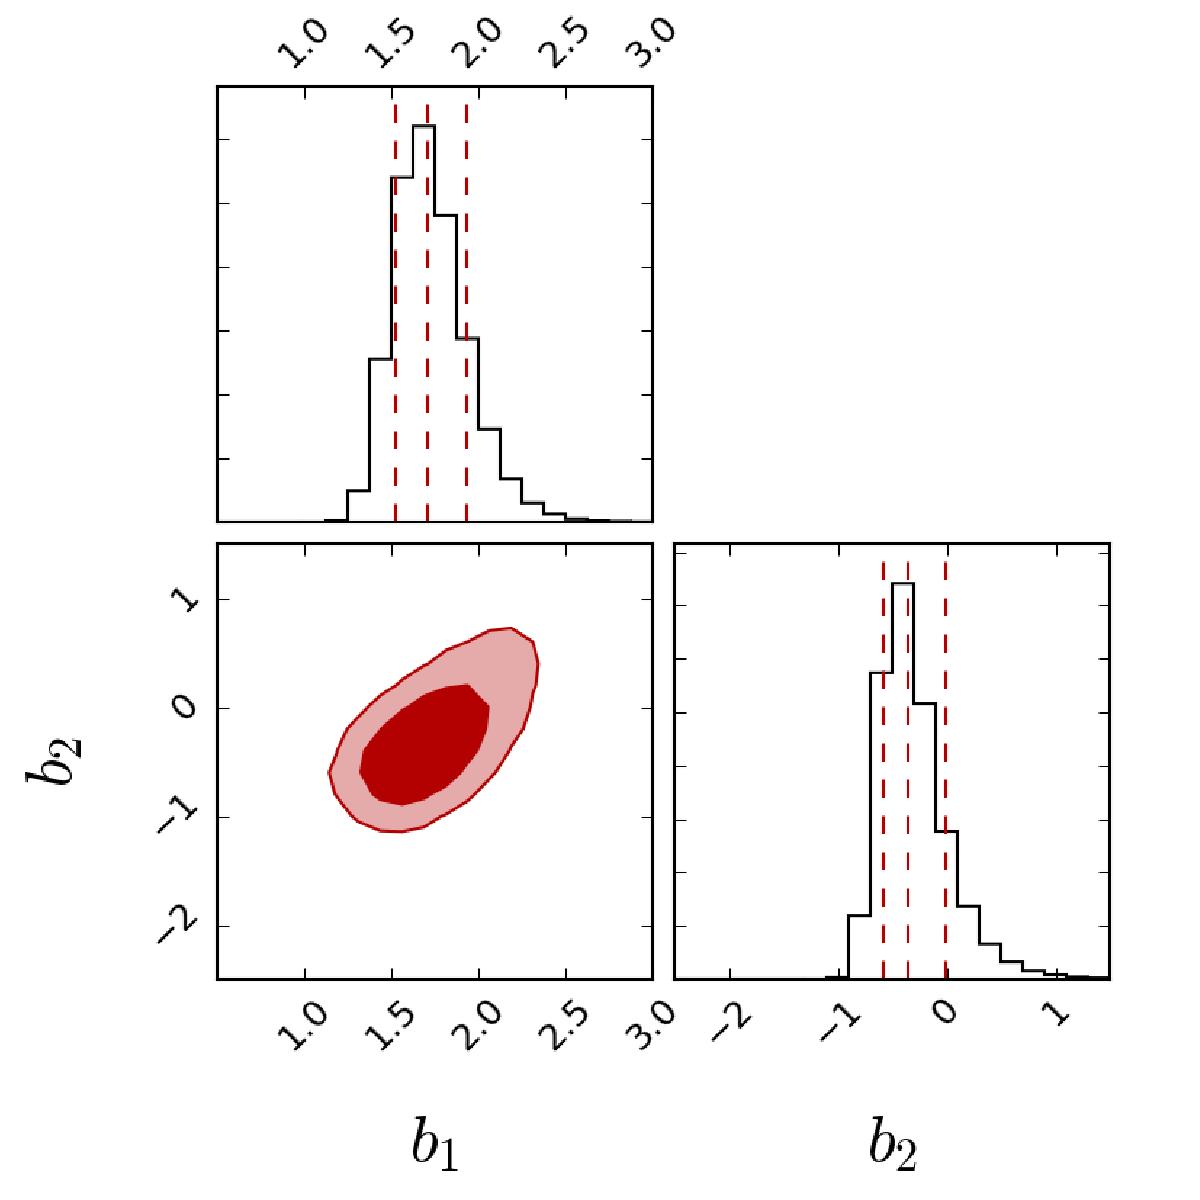
Constraints on b1 and b2 from the log (M/M⊙ ] ) > 9 sample, at scales r12 = 10h-1 Mpc and r13 = 20h-1 Mpc . The contour plot shows the 68% and 95% confidence levels, while the histograms show the posterior distributions for the two parameters. The red dashed lines show the mean, and the 16th and 84th percentiles.
Current usage metrics show cumulative count of Article Views (full-text article views including HTML views, PDF and ePub downloads, according to the available data) and Abstracts Views on Vision4Press platform.
Data correspond to usage on the plateform after 2015. The current usage metrics is available 48-96 hours after online publication and is updated daily on week days.
Initial download of the metrics may take a while.