Fig. 6
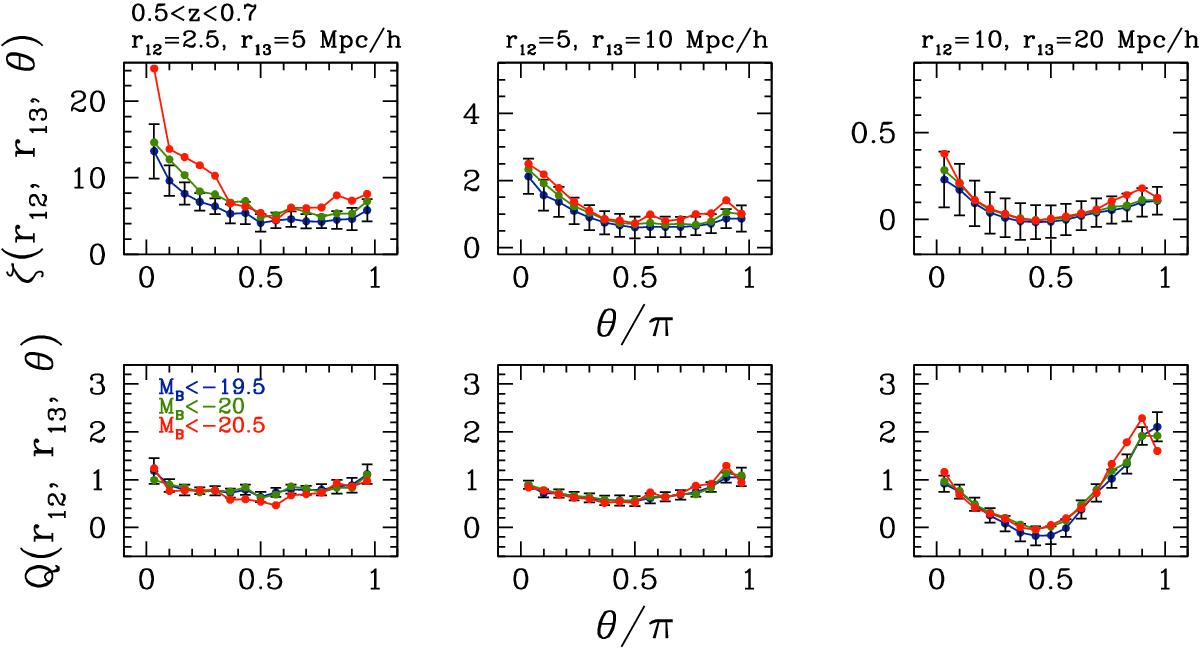
Redshift-space connected 3PCF (upper panels) and reduced 3PCF (lower panels) as a function of luminosity at redshift 0.5 <z< 0.7 for different scales. Different colours show the measurements in the lower (blue), intermediate (green), and higher (red) threshold bins. For clarity reason, error-bars are shown only in the lower bin.
Current usage metrics show cumulative count of Article Views (full-text article views including HTML views, PDF and ePub downloads, according to the available data) and Abstracts Views on Vision4Press platform.
Data correspond to usage on the plateform after 2015. The current usage metrics is available 48-96 hours after online publication and is updated daily on week days.
Initial download of the metrics may take a while.